
- Start >
- Rivers >
- Waterlevel >
- Bayern >
- Eching >
- Chart of month

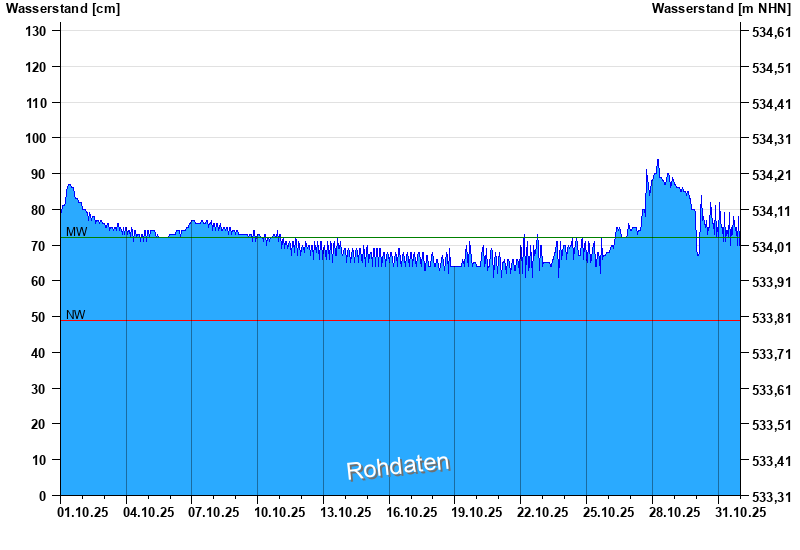
Chart of month Eching / Windach
Waterlevel from 01.10.2025 to 31.10.2025
note
Pegel beeinflusst durch Kraftwerkssteuerung
| Date | Waterlevel [cm] |
|---|---|
| 31.10.2025 23:45 | 71 |
| 31.10.2025 23:30 | 68 |
| 31.10.2025 23:15 | 67 |
| 31.10.2025 23:00 | 68 |
| 31.10.2025 22:45 | 68 |
| 31.10.2025 22:30 | 70 |
| 31.10.2025 22:15 | 73 |
© Bayerisches Landesamt für Umwelt 2025