
- Start >
- Rivers >
- Waterlevel >
- Bayern >
- Eching >
- Chart of month

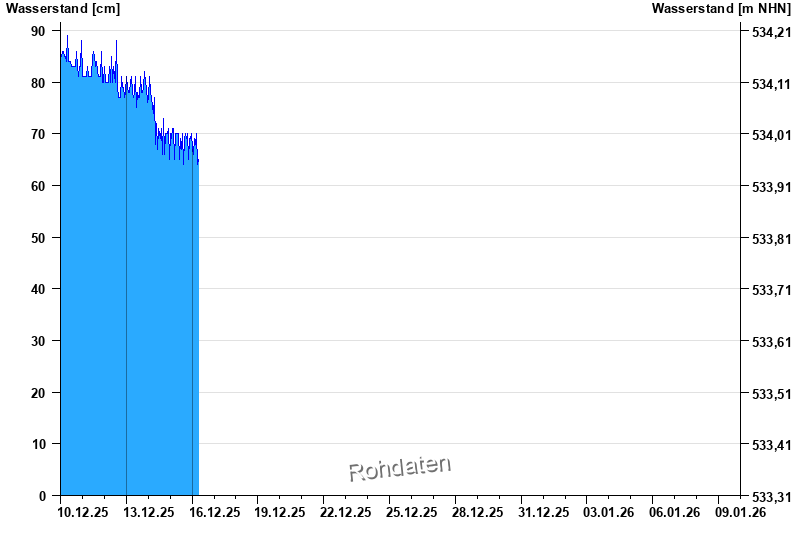
Chart of month Eching / Windach
Waterlevel from 10.12.2025 to 09.01.2026
note
Pegel beeinflusst durch Kraftwerkssteuerung
| Date | Waterlevel [cm] |
|---|---|
| 15.12.2025 22:30 | 63 |
| 15.12.2025 22:15 | 63 |
| 15.12.2025 22:00 | 65 |
| 15.12.2025 21:45 | 69 |
| 15.12.2025 21:30 | 69 |
| 15.12.2025 21:15 | 68 |
| 15.12.2025 21:00 | 66 |
© Bayerisches Landesamt für Umwelt 2025