
- Start >
- Rivers >
- Waterlevel >
- Bayern >
- Bruckberg >
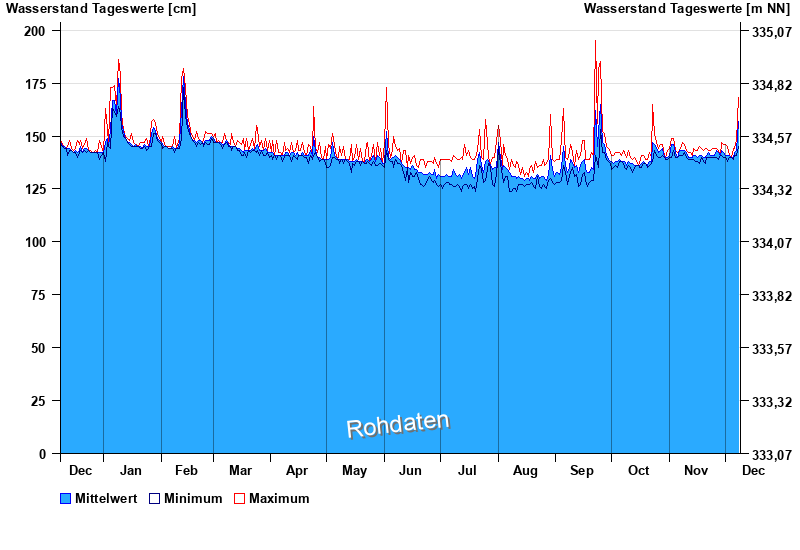
- Chart of year

Chart of year Bruckberg / Haselbach
Waterlevel from 09.12.2024 to 08.12.2025
note
Datenübertragung fällt zeitweise aus.
- 21.12.1993 Wasserstand: 337 cm
- 09.07.2021 Wasserstand: 330 cm
- 30.05.2016 Wasserstand: 329 cm
- 23.05.1978 Wasserstand: 329 cm
- 22.01.2012 Wasserstand: 326 cm
| Date | Mean value [cm] | Maximum [cm] | Minimum [cm] |
|---|---|---|---|
| 08.12.2025 | 157 | 168 | 145 |
| 07.12.2025 | 143 | 148 | 141 |
| 06.12.2025 | 142 | 144 | 141 |
| 05.12.2025 | 140 | 144 | 139 |
| 04.12.2025 | 140 | 140 | 140 |
| 03.12.2025 | 141 | 141 | 140 |
| 02.12.2025 | 141 | 145 | 138 |
© Bayerisches Landesamt für Umwelt 2025