
- Start >
- Rivers >
- Waterlevel >
- Bayern >
- Bayreuth >
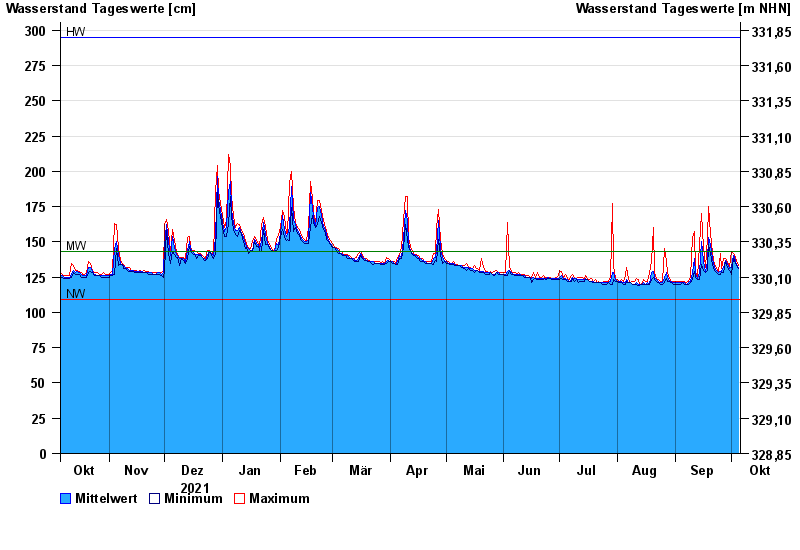
- Chart of year

Chart of year Bayreuth / Roter Main
Waterlevel from 06.10.2021 to 05.10.2022
| Date | Mean value [cm] | Maximum [cm] | Minimum [cm] |
|---|---|---|---|
| 05.10.2022 | 132 | 133 | 131 |
| 04.10.2022 | 134 | 137 | 133 |
| 03.10.2022 | 139 | 141 | 137 |
| 02.10.2022 | 140 | 142 | 138 |
| 01.10.2022 | 132 | 143 | 127 |
| 30.09.2022 | 131 | 132 | 130 |
| 29.09.2022 | 134 | 136 | 132 |
© Bayerisches Landesamt für Umwelt 2024