
- Start >
- Rivers >
- Waterlevel >
- Bayern >
- Bad Wiessee >
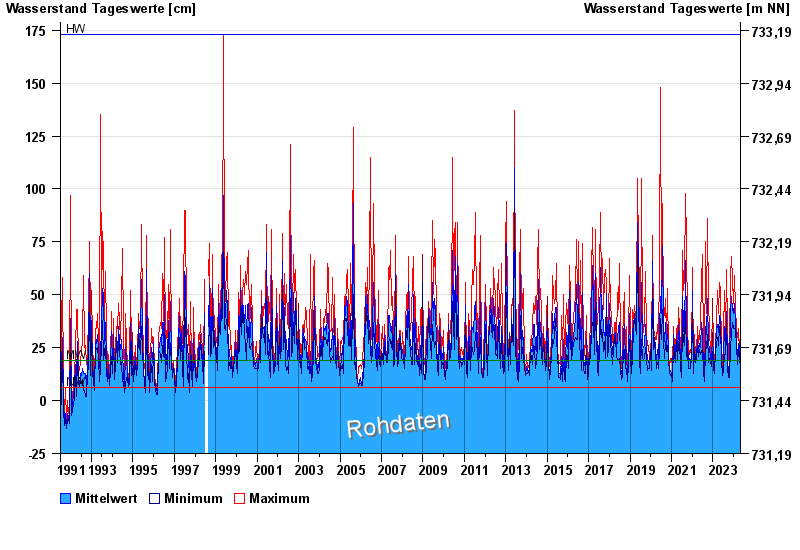
- Chart of total period

Chart of total period Bad Wiessee / Söllbach
Waterlevel from 04.07.1991 to 01.05.2024
| Date | Mean value [cm] | Maximum [cm] | Minimum [cm] |
|---|---|---|---|
| 01.05.2024 | 31 | 31 | 31 |
| 30.04.2024 | 32 | 36 | 29 |
| 29.04.2024 | 31 | 36 | 27 |
| 28.04.2024 | 29 | 35 | 24 |
| 27.04.2024 | 22 | 28 | 18 |
| 26.04.2024 | 17 | 21 | 15 |
| 25.04.2024 | 15 | 16 | 14 |
© Bayerisches Landesamt für Umwelt 2024