
- Start >
- Rivers >
- Waterlevel >
- Bayern >
- Bad Aibling >
- Chart of total period

Chart of total period Bad Aibling / Glonn
Waterlevel from 30.10.1939 to 08.05.2024
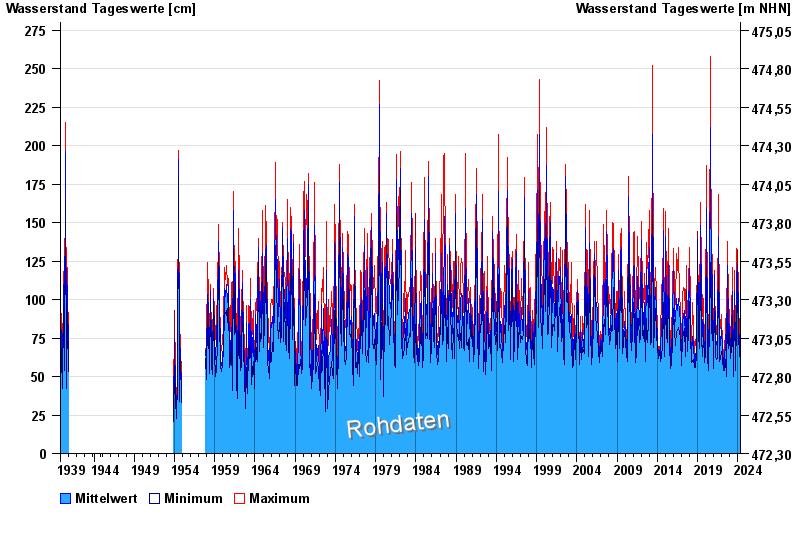
- Hochwassergefahrenfläche HQ100 290 cm
| Date | Mean value [cm] | Maximum [cm] | Minimum [cm] |
|---|---|---|---|
| 08.05.2024 | 54 | 55 | 53 |
| 07.05.2024 | 57 | 65 | 52 |
| 06.05.2024 | 53 | 61 | 49 |
| 05.05.2024 | 51 | 53 | 50 |
| 04.05.2024 | 52 | 54 | 49 |
| 03.05.2024 | 52 | 53 | 49 |
| 02.05.2024 | 52 | 54 | 51 |
© Bayerisches Landesamt für Umwelt 2024