
- Start >
- Rivers >
- Waterlevel >
- Bayern >
- Au b. Bad Aibling >
- Chart of total period

Chart of total period Au b. Bad Aibling / Aubach
Waterlevel from 01.11.1976 to 09.05.2024
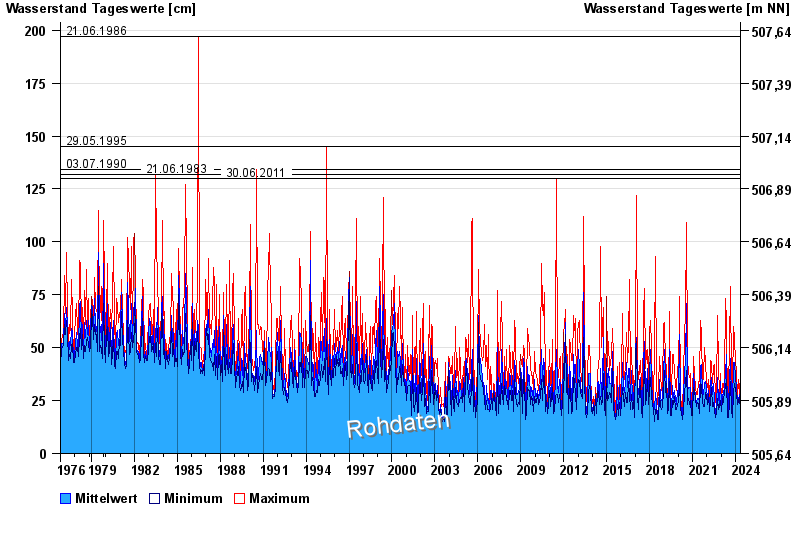
- 21.06.1986 Wasserstand: 197 cm
- 29.05.1995 Wasserstand: 145 cm
- 03.07.1990 Wasserstand: 134 cm
- 21.06.1983 Wasserstand: 132 cm
- 30.06.2011 Wasserstand: 130 cm
| Date | Mean value [cm] | Maximum [cm] | Minimum [cm] |
|---|---|---|---|
| 09.05.2024 | 21 | 21 | 20 |
| 08.05.2024 | 21 | 22 | 18 |
| 07.05.2024 | 17 | 21 | 17 |
| 06.05.2024 | 17 | 18 | 17 |
| 05.05.2024 | 17 | 17 | 17 |
| 04.05.2024 | 17 | 18 | 17 |
| 03.05.2024 | 17 | 18 | 17 |
© Bayerisches Landesamt für Umwelt 2024