
- Start >
- Rivers >
- Discharge >
- Regnitz >
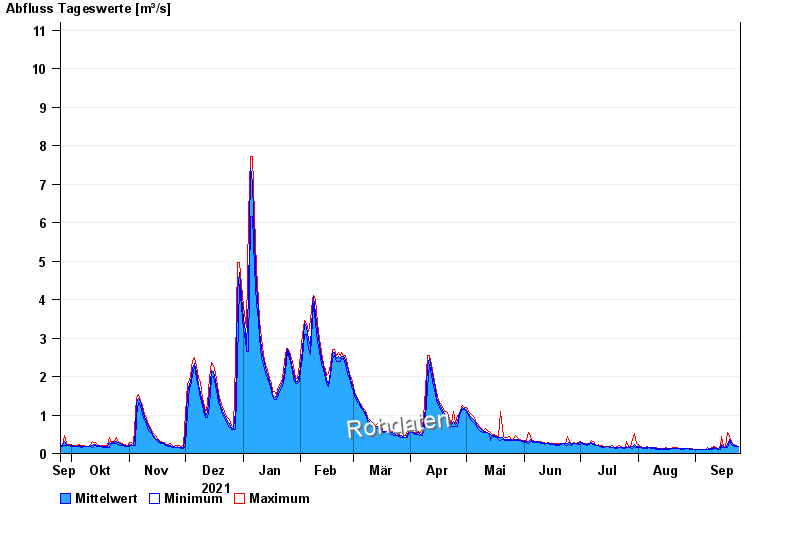
- Unterleinleiter >
- Chart of year

Chart of year Unterleinleiter / Leinleiterbach
Discharge from 25.09.2021 to 24.09.2022
- 23.02.1970 Abfluss: 31 m³/s
- 26.01.1995 Abfluss: 30,7 m³/s
- 06.01.1982 Abfluss: 23,5 m³/s
- 26.03.1988 Abfluss: 21 m³/s
- 14.01.2011 Abfluss: 19,1 m³/s
| Date | Mean value [m³/s] | Maximum [m³/s] | Minimum [m³/s] |
|---|---|---|---|
| 24.09.2022 | 0.187 | 0.191 | 0.178 |
| 23.09.2022 | 0.2 | 0.206 | 0.178 |
| 22.09.2022 | 0.215 | 0.223 | 0.191 |
| 21.09.2022 | 0.234 | 0.241 | 0.206 |
| 20.09.2022 | 0.275 | 0.305 | 0.241 |
| 19.09.2022 | 0.361 | 0.448 | 0.305 |
| 18.09.2022 | 0.228 | 0.555 | 0.154 |
© Bayerisches Landesamt für Umwelt 2024