
- Start >
- Rivers >
- Discharge >
- Regnitz >
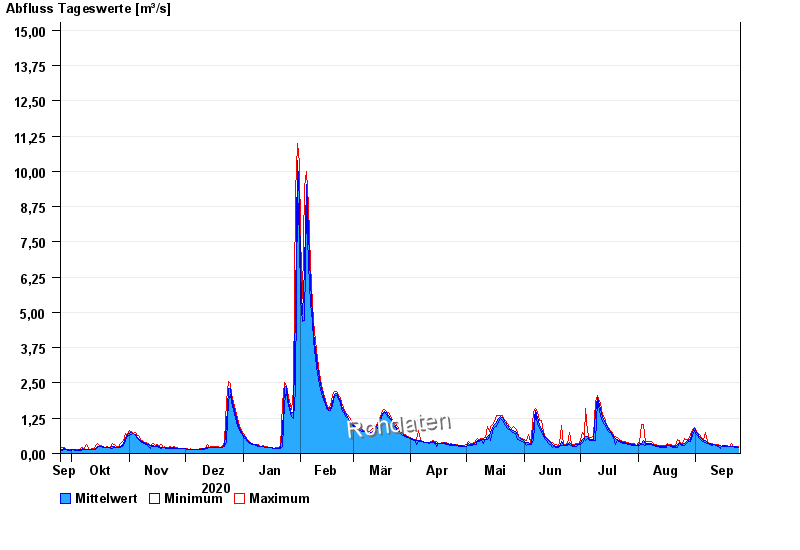
- Unterleinleiter >
- Chart of year

Chart of year Unterleinleiter / Leinleiterbach
Discharge from 25.09.2020 to 24.09.2021
- 23.02.1970 Abfluss: 31 m³/s
- 26.01.1995 Abfluss: 30,7 m³/s
- 06.01.1982 Abfluss: 23,5 m³/s
- 26.03.1988 Abfluss: 21 m³/s
- 14.01.2011 Abfluss: 19,1 m³/s
| Date | Mean value [m³/s] | Maximum [m³/s] | Minimum [m³/s] |
|---|---|---|---|
| 24.09.2021 | 0.217 | 0.236 | 0.2 |
| 23.09.2021 | 0.231 | 0.258 | 0.217 |
| 22.09.2021 | 0.237 | 0.258 | 0.218 |
| 21.09.2021 | 0.238 | 0.258 | 0.237 |
| 20.09.2021 | 0.25 | 0.361 | 0.237 |
| 19.09.2021 | 0.258 | 0.259 | 0.238 |
| 18.09.2021 | 0.257 | 0.282 | 0.238 |
© Bayerisches Landesamt für Umwelt 2024