

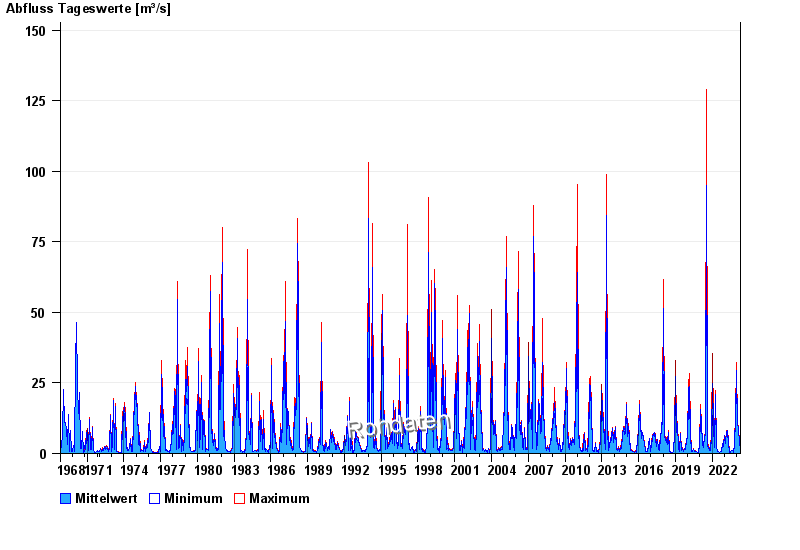
Chart of total period Thann / Altmühl
Discharge from 01.11.1968 to 26.04.2024
| Date | Mean value [m³/s] | Maximum [m³/s] | Minimum [m³/s] |
|---|---|---|---|
| 26.04.2024 | 1.6 | 1.65 | 1.5 |
| 25.04.2024 | 1.74 | 1.86 | 1.65 |
| 24.04.2024 | 2.05 | 2.3 | 1.86 |
| 23.04.2024 | 2.48 | 2.61 | 2.3 |
| 22.04.2024 | 2.55 | 2.61 | 2.43 |
| 21.04.2024 | 2.19 | 2.43 | 1.93 |
| 20.04.2024 | 1.72 | 1.93 | 1.48 |
© Bayerisches Landesamt für Umwelt 2024