

Chart of total period Thann / Altmühl
Discharge from 01.11.1968 to 26.04.2024
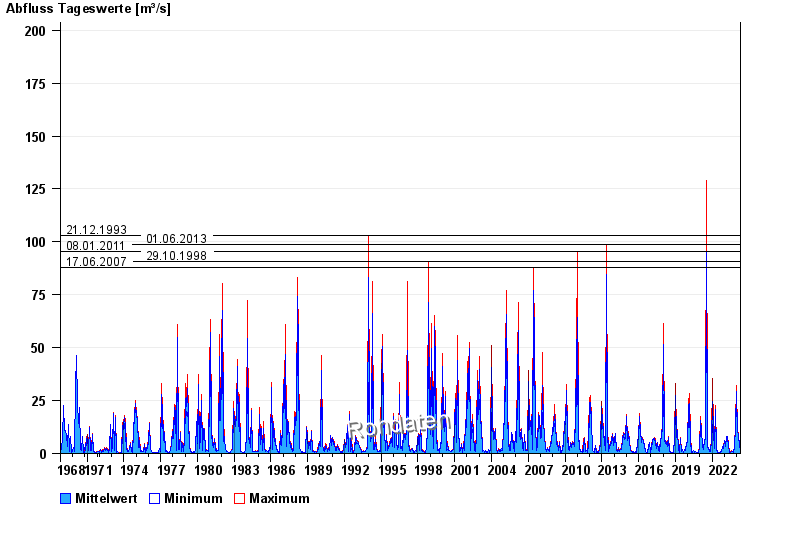
- 21.12.1993 Abfluss: 103 m³/s
- 01.06.2013 Abfluss: 98,9 m³/s
- 08.01.2011 Abfluss: 95,4 m³/s
- 29.10.1998 Abfluss: 90,8 m³/s
- 17.06.2007 Abfluss: 87,9 m³/s
| Date | Mean value [m³/s] | Maximum [m³/s] | Minimum [m³/s] |
|---|---|---|---|
| 26.04.2024 | 1.6 | 1.65 | 1.56 |
| 25.04.2024 | 1.74 | 1.86 | 1.65 |
| 24.04.2024 | 2.05 | 2.3 | 1.86 |
| 23.04.2024 | 2.48 | 2.61 | 2.3 |
| 22.04.2024 | 2.55 | 2.61 | 2.43 |
| 21.04.2024 | 2.19 | 2.43 | 1.93 |
| 20.04.2024 | 1.72 | 1.93 | 1.48 |
© Bayerisches Landesamt für Umwelt 2024