
- Start >
- Rivers >
- Discharge >
- Regnitz >
- Scheinfeld >
- Chart of year

Chart of year Scheinfeld / Scheine
Discharge from 29.03.2024 to 28.03.2025
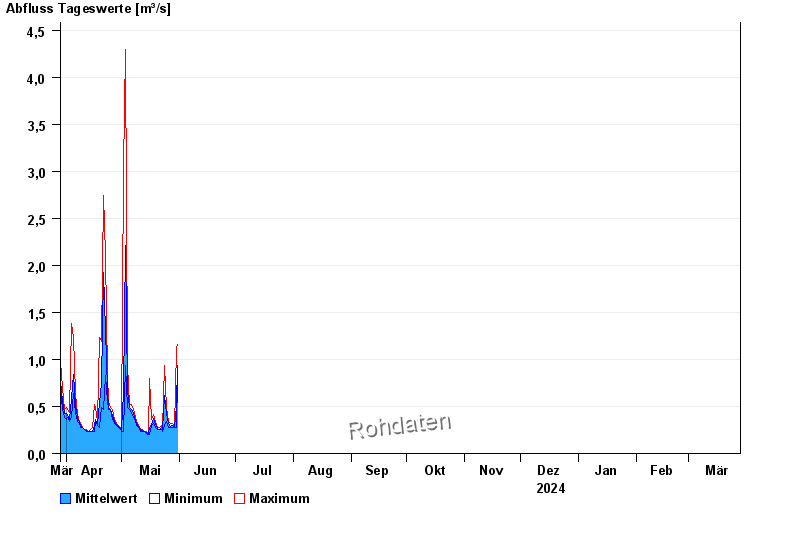
| Date | Mean value [m³/s] | Maximum [m³/s] | Minimum [m³/s] |
|---|---|---|---|
| 20.05.2024 | 0.272 | 0.272 | 0.272 |
| 19.05.2024 | 0.308 | 0.338 | 0.272 |
| 18.05.2024 | 0.371 | 0.411 | 0.315 |
| 17.05.2024 | 0.305 | 0.362 | 0.293 |
| 16.05.2024 | 0.275 | 0.797 | 0.198 |
| 15.05.2024 | 0.21 | 0.215 | 0.198 |
| 14.05.2024 | 0.225 | 0.233 | 0.215 |
© Bayerisches Landesamt für Umwelt 2024