
- Start >
- Rivers >
- Discharge >
- Regnitz >
- Scheinfeld >
- Chart of year

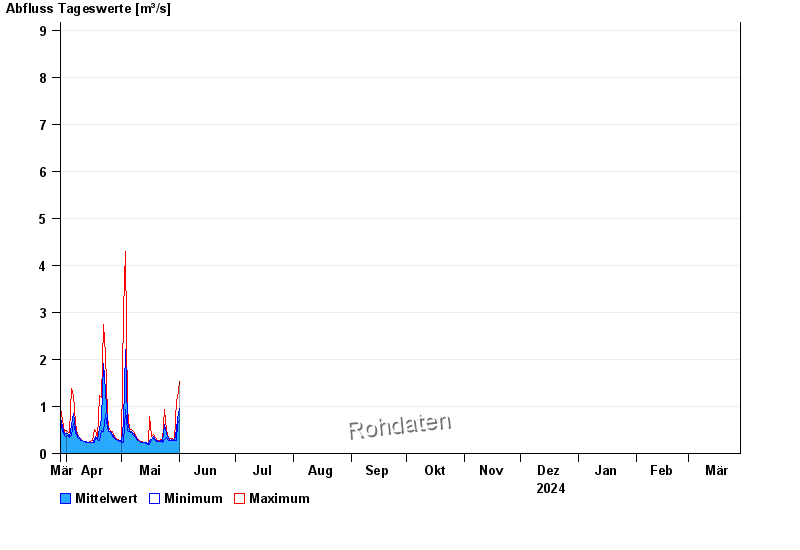
Chart of year Scheinfeld / Scheine
Discharge from 29.03.2024 to 28.03.2025
 Für diesen Pegel sind keine Jährlichkeiten hinterlegt.
| Date | Mean value [m³/s] | Maximum [m³/s] | Minimum [m³/s] |
|---|---|---|---|
| 01.06.2024 | 1.51 | 3.9 | 0.701 |
| 31.05.2024 | 0.736 | 1.16 | 0.638 |
| 30.05.2024 | 0.509 | 1.12 | 0.272 |
| 29.05.2024 | 0.272 | 0.272 | 0.272 |
| 28.05.2024 | 0.301 | 0.315 | 0.272 |
| 27.05.2024 | 0.287 | 0.315 | 0.272 |
| 26.05.2024 | 0.314 | 0.338 | 0.272 |
© Bayerisches Landesamt für Umwelt 2024