
- Start >
- Rivers >
- Discharge >
- Regnitz >
- Neu Ulm, Bad Held >
- Chart of year

Chart of year Neu Ulm, Bad Held / Donau
Discharge from 26.05.2021 to 25.05.2022
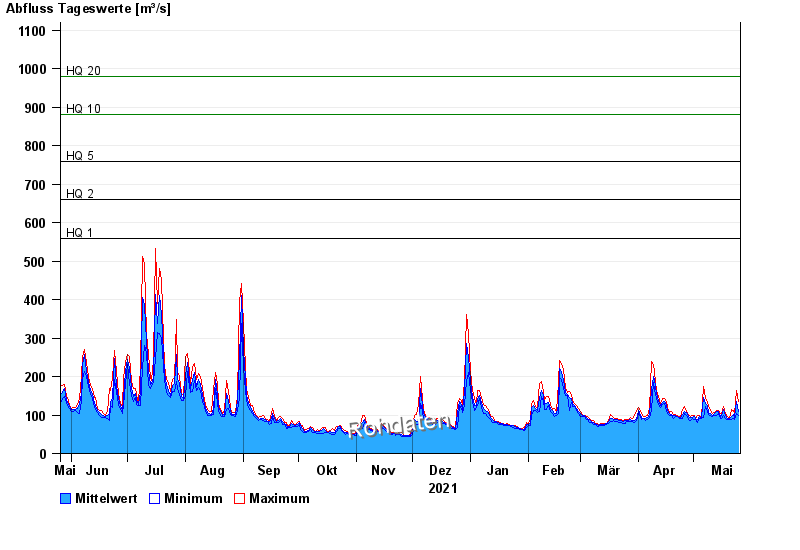
ACHTUNG!
Pegel durch außerordentlichen Kraftwerksbetrieb beeinflusst.
- HQ1 560 m³/s
- HQ2 660 m³/s
- HQ5 760 m³/s
- HQ10 880 m³/s
- HQ20 980 m³/s
- HQ50 1110 m³/s
- HQ100 1250 m³/s
| Date | Mean value [m³/s] | Maximum [m³/s] | Minimum [m³/s] |
|---|---|---|---|
| 25.05.2022 | 109 | 135 | 98.5 |
| 24.05.2022 | 135 | 165 | 103 |
| 23.05.2022 | 93 | 105 | 89.2 |
| 22.05.2022 | 101 | 112 | 90.7 |
| 21.05.2022 | 96.9 | 115 | 89.2 |
| 20.05.2022 | 91.2 | 92.1 | 87.9 |
| 19.05.2022 | 91.7 | 95.4 | 87.9 |
© Bayerisches Landesamt für Umwelt 2024