
- Start >
- Rivers >
- Discharge >
- Regnitz >
- Neu Ulm, Bad Held >
- Chart of year

Chart of year Neu Ulm, Bad Held / Donau
Discharge from 26.05.2022 to 25.05.2023
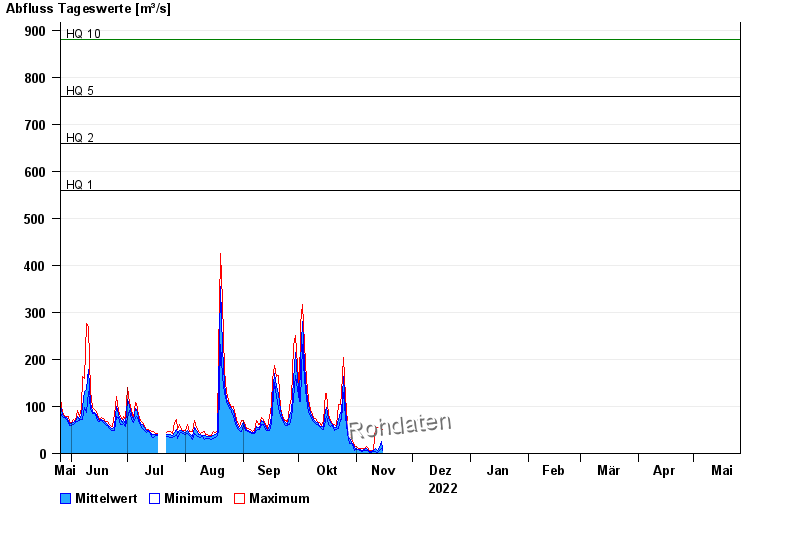
ACHTUNG!
Pegel durch außerordentlichen Kraftwerksbetrieb beeinflusst.
- HQ1 560 m³/s
- HQ2 660 m³/s
- HQ5 760 m³/s
- HQ10 880 m³/s
- HQ20 980 m³/s
- HQ50 1110 m³/s
- HQ100 1250 m³/s
| Date | Mean value [m³/s] | Maximum [m³/s] | Minimum [m³/s] |
|---|---|---|---|
| 15.11.2022 | 8.77 | 51.4 | 5.83 |
| 14.11.2022 | 25.2 | 51.7 | 11.3 |
| 13.11.2022 | 11.9 | 55.6 | 5.83 |
| 12.11.2022 | 6.89 | 55.4 | 1.9 |
| 11.11.2022 | 11.1 | 57.4 | 4.82 |
| 10.11.2022 | 5.63 | 6.86 | 3.83 |
| 09.11.2022 | 4.04 | 5.83 | 1.9 |
© Bayerisches Landesamt für Umwelt 2024