
- Start >
- Rivers >
- Discharge >
- Regnitz >
- Muggendorf >
- Chart of year

Chart of year Muggendorf / Wiesent
Discharge from 17.09.2020 to 16.09.2021
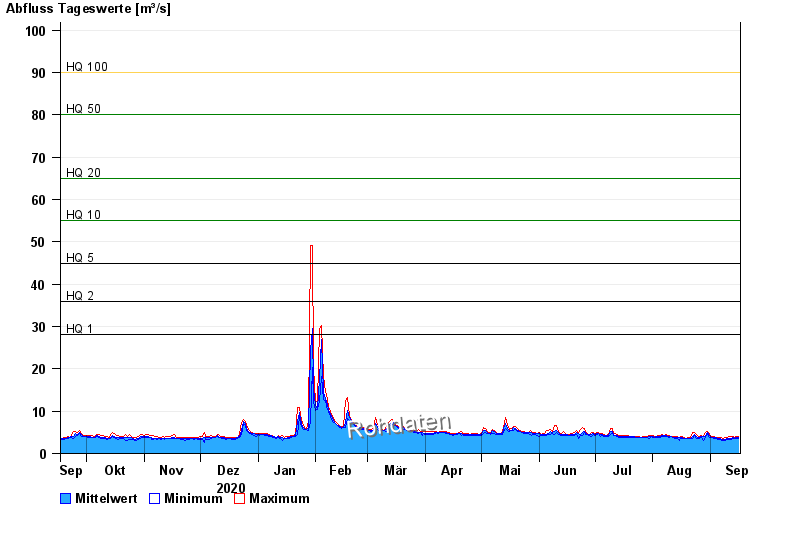
- HQ1 28 m³/s
- HQ2 36 m³/s
- HQ5 45 m³/s
- HQ10 55 m³/s
- HQ20 65 m³/s
- HQ50 80 m³/s
- HQ100 90 m³/s
| Date | Mean value [m³/s] | Maximum [m³/s] | Minimum [m³/s] |
|---|---|---|---|
| 16.09.2021 | 3.73 | 3.96 | 3.59 |
| 15.09.2021 | 3.78 | 4 | 3.6 |
| 14.09.2021 | 3.64 | 3.72 | 3.44 |
| 13.09.2021 | 3.67 | 3.98 | 3.52 |
| 12.09.2021 | 3.56 | 3.92 | 3.42 |
| 11.09.2021 | 3.54 | 3.97 | 3.34 |
| 10.09.2021 | 3.5 | 3.68 | 3.31 |
© Bayerisches Landesamt für Umwelt 2024