
- Start >
- Rivers >
- Discharge >
- Regnitz >
- Muggendorf >
- Chart of year

Chart of year Muggendorf / Wiesent
Discharge from 17.09.2021 to 16.09.2022
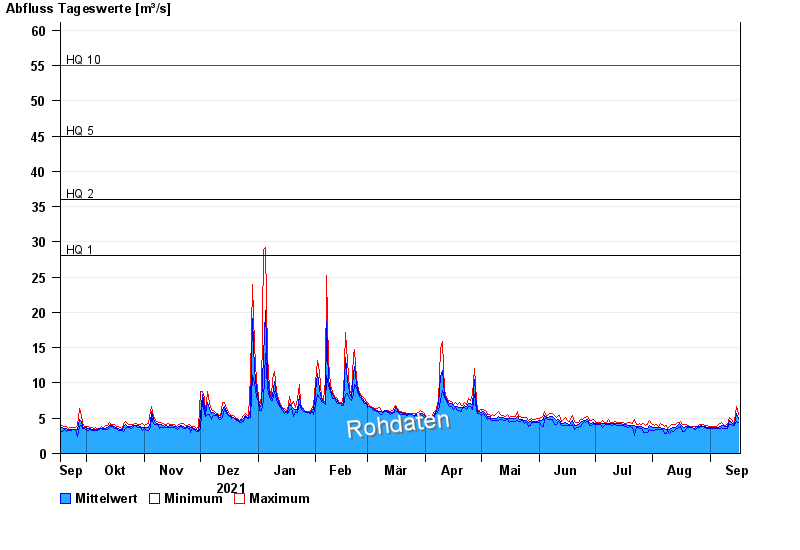
- HQ1 28 m³/s
- HQ2 36 m³/s
- HQ5 45 m³/s
- HQ10 55 m³/s
- HQ20 65 m³/s
- HQ50 80 m³/s
- HQ100 90 m³/s
| Date | Mean value [m³/s] | Maximum [m³/s] | Minimum [m³/s] |
|---|---|---|---|
| 16.09.2022 | 4.97 | 5.56 | 4.38 |
| 15.09.2022 | 5.63 | 6.71 | 4.52 |
| 14.09.2022 | 4.32 | 4.66 | 3.98 |
| 13.09.2022 | 4.07 | 4.24 | 3.98 |
| 12.09.2022 | 4.41 | 4.8 | 4.1 |
| 11.09.2022 | 4.74 | 5.1 | 4.1 |
| 10.09.2022 | 3.8 | 4.11 | 3.6 |
© Bayerisches Landesamt für Umwelt 2024