
- Start >
- Rivers >
- Discharge >
- Regnitz >
- Laubendorf >
- Chart of year

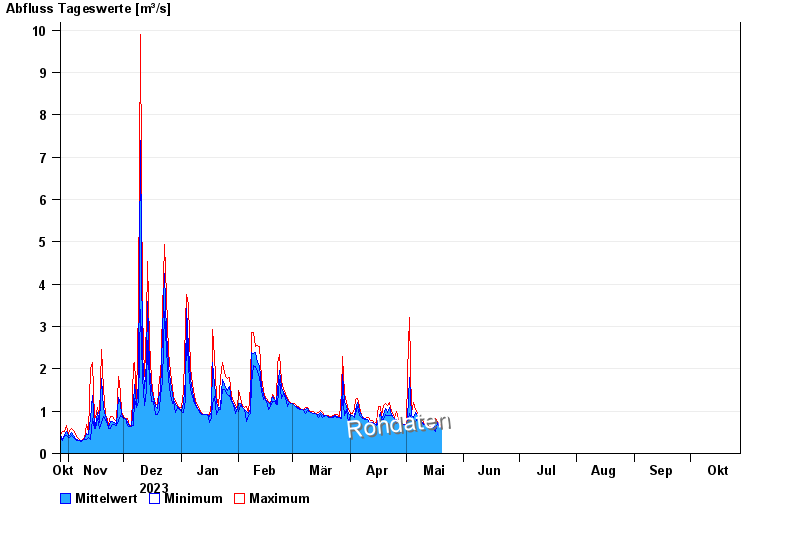
Chart of year Laubendorf / Zenn
Discharge from 28.10.2023 to 27.10.2024
| Date | Mean value [m³/s] | Maximum [m³/s] | Minimum [m³/s] |
|---|---|---|---|
| 09.05.2024 | 0.781 | 0.792 | 0.771 |
| 08.05.2024 | 0.82 | 0.839 | 0.792 |
| 07.05.2024 | 0.905 | 0.963 | 0.818 |
| 06.05.2024 | 0.98 | 1.04 | 0.746 |
| 05.05.2024 | 0.859 | 1.2 | 0.746 |
| 04.05.2024 | 0.895 | 0.963 | 0.818 |
| 03.05.2024 | 1.79 | 3.22 | 0.941 |
© Bayerisches Landesamt für Umwelt 2024