
- Start >
- Rivers >
- Discharge >
- Regnitz >
- Laubendorf >
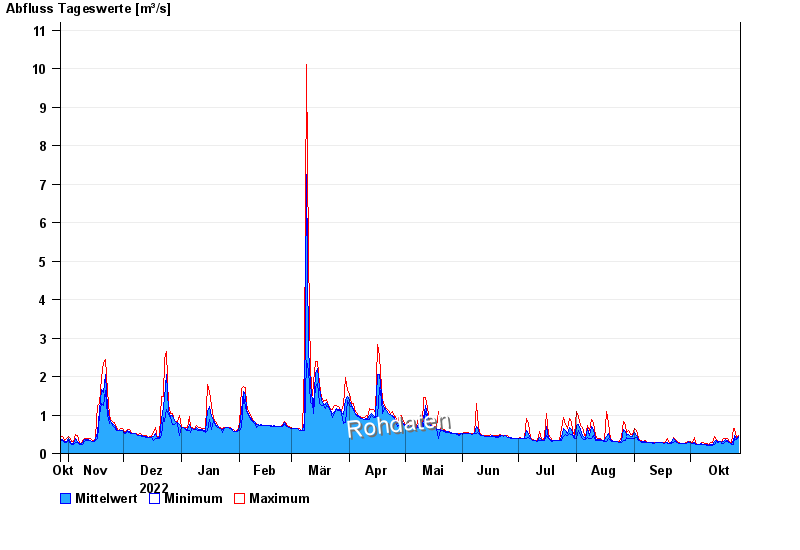
- Chart of year

Chart of year Laubendorf / Zenn
Discharge from 28.10.2022 to 27.10.2023
| Date | Mean value [m³/s] | Maximum [m³/s] | Minimum [m³/s] |
|---|---|---|---|
| 27.10.2023 | 0.433 | 0.459 | 0.418 |
| 26.10.2023 | 0.377 | 0.418 | 0.36 |
| 25.10.2023 | 0.48 | 0.637 | 0.398 |
| 24.10.2023 | 0.35 | 0.637 | 0.245 |
| 23.10.2023 | 0.247 | 0.275 | 0.245 |
| 22.10.2023 | 0.278 | 0.307 | 0.275 |
| 21.10.2023 | 0.343 | 0.379 | 0.307 |
© Bayerisches Landesamt für Umwelt 2024