
- Start >
- Rivers >
- Discharge >
- Regnitz >
- Laubendorf >
- Chart of year

Chart of year Laubendorf / Zenn
Discharge from 04.03.2020 to 03.03.2021
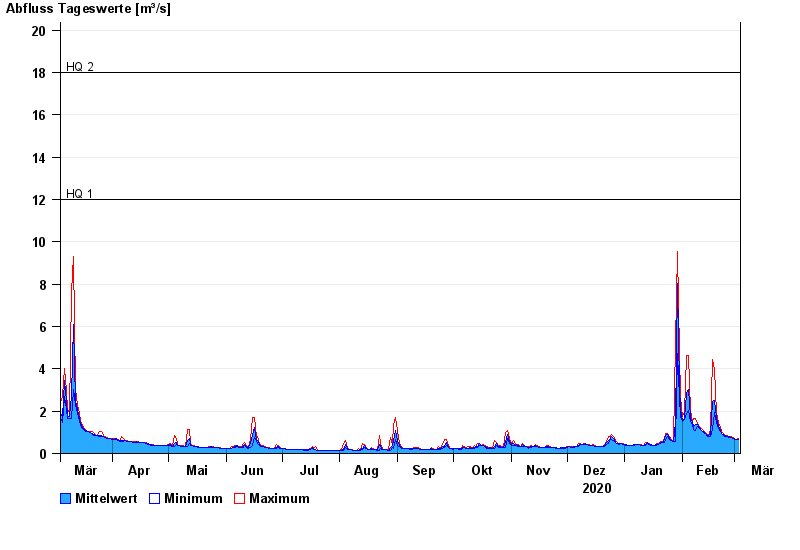
- HQ1 12 m³/s
- HQ2 18 m³/s
- HQ5 27 m³/s
- HQ10 37 m³/s
- HQ20 48 m³/s
- HQ50 68 m³/s
- HQ100 86 m³/s
| Date | Mean value [m³/s] | Maximum [m³/s] | Minimum [m³/s] |
|---|---|---|---|
| 03.03.2021 | 0.656 | 0.693 | 0.648 |
| 02.03.2021 | 0.673 | 0.674 | 0.672 |
| 01.03.2021 | 0.687 | 0.698 | 0.674 |
| 28.02.2021 | 0.719 | 0.747 | 0.698 |
| 27.02.2021 | 0.772 | 0.797 | 0.747 |
| 26.02.2021 | 0.79 | 0.799 | 0.773 |
| 25.02.2021 | 0.817 | 0.849 | 0.799 |
© Bayerisches Landesamt für Umwelt 2024