
- Start >
- Rivers >
- Discharge >
- Regnitz >
- Laubendorf >
- Chart of year

Chart of year Laubendorf / Zenn
Discharge from 04.03.2021 to 03.03.2022
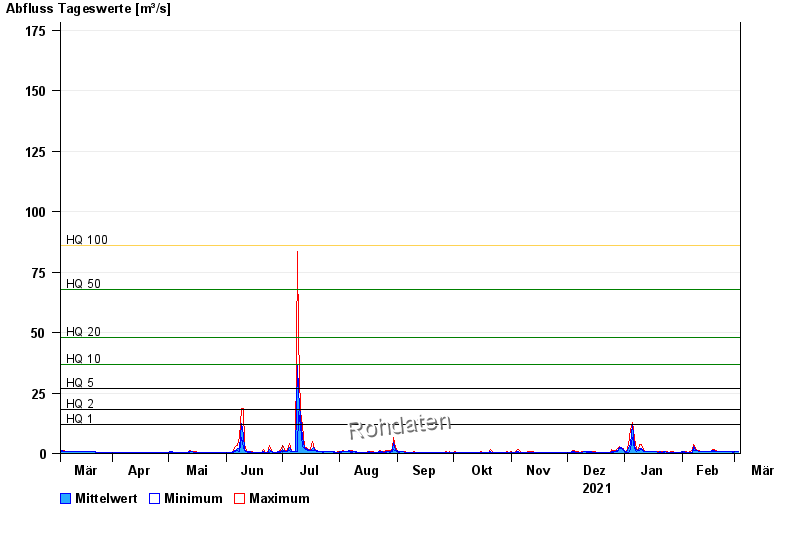
- HQ1 12 m³/s
- HQ2 18 m³/s
- HQ5 27 m³/s
- HQ10 37 m³/s
- HQ20 48 m³/s
- HQ50 68 m³/s
- HQ100 86 m³/s
| Date | Mean value [m³/s] | Maximum [m³/s] | Minimum [m³/s] |
|---|---|---|---|
| 03.03.2022 | 0.643 | 0.66 | 0.637 |
| 02.03.2022 | 0.66 | 0.66 | 0.66 |
| 01.03.2022 | 0.671 | 0.683 | 0.66 |
| 28.02.2022 | 0.69 | 0.732 | 0.551 |
| 27.02.2022 | 0.762 | 0.782 | 0.732 |
| 26.02.2022 | 0.839 | 0.863 | 0.782 |
| 25.02.2022 | 0.897 | 0.919 | 0.863 |
© Bayerisches Landesamt für Umwelt 2024