
- Start >
- Rivers >
- Discharge >
- Regnitz >
- Kreppendorf >
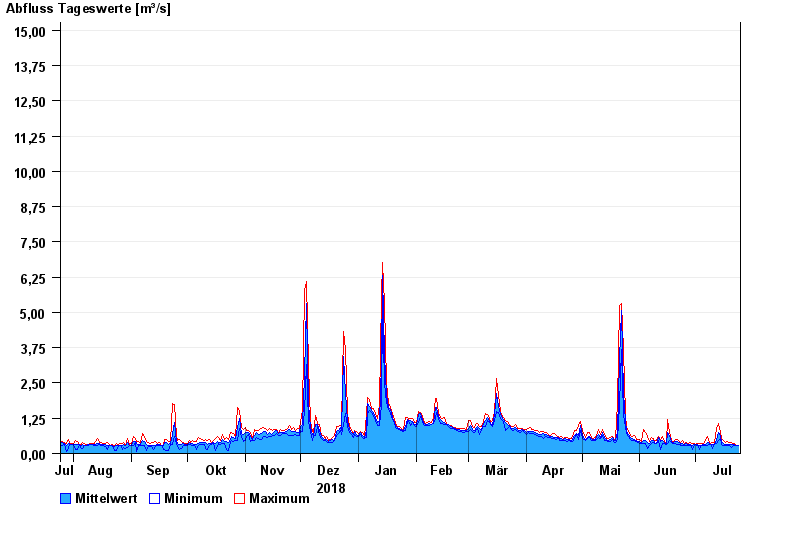
- Chart of year

Chart of year Kreppendorf / Zenn
Discharge from 25.07.2018 to 24.07.2019
- HQ1 23 m³/s
- HQ2 36 m³/s
- HQ5 49 m³/s
- HQ10 63 m³/s
- HQ20 77 m³/s
- HQ50 98 m³/s
- HQ100 115 m³/s
| Date | Mean value [m³/s] | Maximum [m³/s] | Minimum [m³/s] |
|---|---|---|---|
| 24.07.2019 | 0.29 | 0.295 | 0.277 |
| 23.07.2019 | 0.295 | 0.296 | 0.295 |
| 22.07.2019 | 0.316 | 0.351 | 0.279 |
| 21.07.2019 | 0.325 | 0.353 | 0.296 |
| 20.07.2019 | 0.308 | 0.394 | 0.205 |
| 19.07.2019 | 0.32 | 0.395 | 0.299 |
| 18.07.2019 | 0.327 | 0.418 | 0.282 |
© Bayerisches Landesamt für Umwelt 2024