
- Start >
- Rivers >
- Discharge >
- Regnitz >
- Kreppendorf >
- Chart of year

Chart of year Kreppendorf / Zenn
Discharge from 25.07.2019 to 24.07.2020
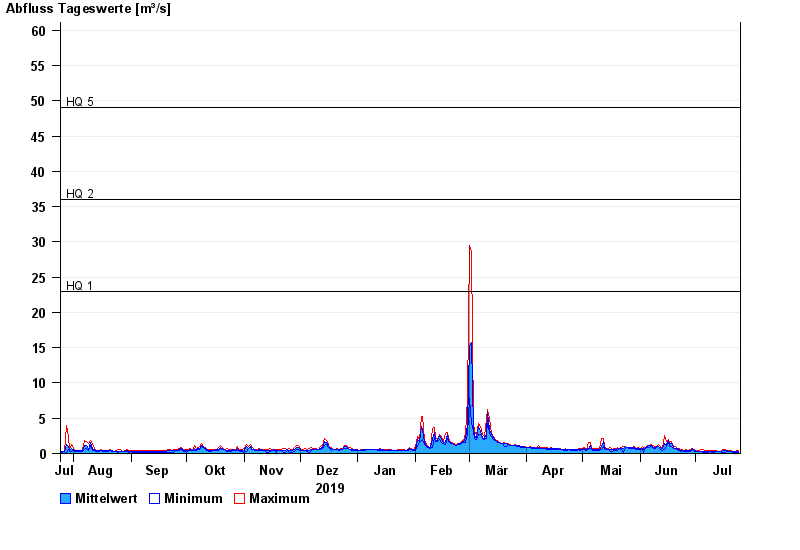
- HQ1 23 m³/s
- HQ2 36 m³/s
- HQ5 49 m³/s
- HQ10 63 m³/s
- HQ20 77 m³/s
- HQ50 98 m³/s
- HQ100 115 m³/s
| Date | Mean value [m³/s] | Maximum [m³/s] | Minimum [m³/s] |
|---|---|---|---|
| 24.07.2020 | 0.27 | 0.382 | 0.078 |
| 23.07.2020 | 0.259 | 0.382 | 0.078 |
| 22.07.2020 | 0.257 | 0.339 | 0.072 |
| 21.07.2020 | 0.253 | 0.283 | 0.091 |
| 20.07.2020 | 0.282 | 0.382 | 0.25 |
| 19.07.2020 | 0.3 | 0.36 | 0.25 |
| 18.07.2020 | 0.378 | 0.48 | 0.25 |
© Bayerisches Landesamt für Umwelt 2024