

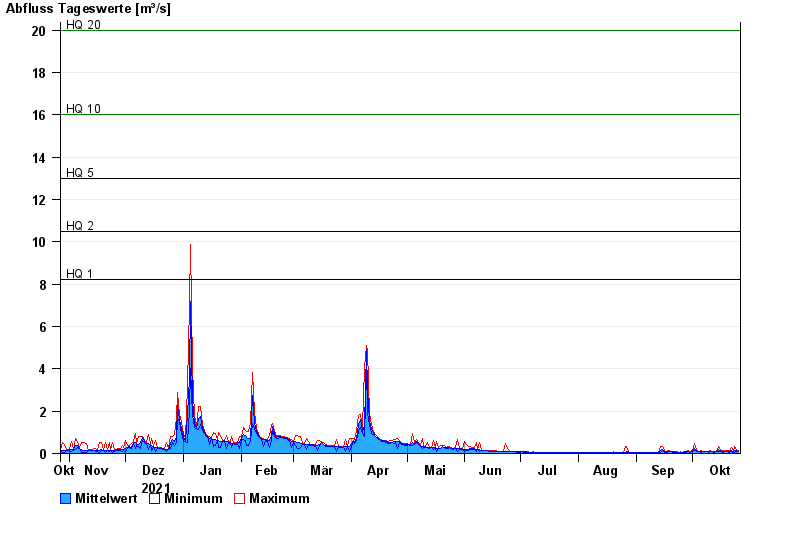
Chart of year Illesheim / Aisch
Discharge from 27.10.2021 to 26.10.2022
note
Wasserstand und Abfluss wird zeitweise durch Biberdamm beeinflusst.
- HQ1 8,2 m³/s
- HQ2 10,5 m³/s
- HQ5 13 m³/s
- HQ10 16 m³/s
- HQ20 20 m³/s
- HQ50 27 m³/s
- HQ100 32 m³/s
| Date | Mean value [m³/s] | Maximum [m³/s] | Minimum [m³/s] |
|---|---|---|---|
| 26.10.2022 | 0.101 | 0.136 | 0.076 |
| 25.10.2022 | 0.133 | 0.155 | 0.114 |
| 24.10.2022 | 0.165 | 0.328 | 0.065 |
| 23.10.2022 | 0.079 | 0.099 | 0.065 |
| 22.10.2022 | 0.148 | 0.267 | 0.099 |
| 21.10.2022 | 0.103 | 0.149 | 0.065 |
| 20.10.2022 | 0.092 | 0.121 | 0.077 |
© Bayerisches Landesamt für Umwelt 2024