

Chart of year Illesheim / Aisch
Discharge from 27.10.2020 to 26.10.2021
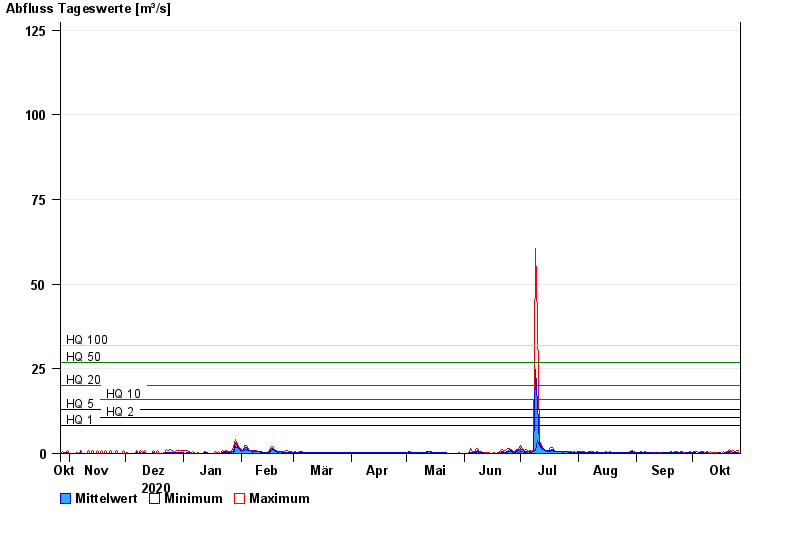
note
Wasserstand und Abfluss wird zeitweise durch Biberdamm beeinflusst.
- HQ1 8,2 m³/s
- HQ2 10,5 m³/s
- HQ5 13 m³/s
- HQ10 16 m³/s
- HQ20 20 m³/s
- HQ50 27 m³/s
- HQ100 32 m³/s
| Date | Mean value [m³/s] | Maximum [m³/s] | Minimum [m³/s] |
|---|---|---|---|
| 26.10.2021 | 0.209 | 0.885 | 0.047 |
| 25.10.2021 | 0.269 | 0.816 | 0.057 |
| 24.10.2021 | 0.291 | 0.341 | 0.246 |
| 23.10.2021 | 0.441 | 1.01 | 0.181 |
| 22.10.2021 | 0.574 | 0.71 | 0.487 |
| 21.10.2021 | 0.603 | 1.17 | 0.182 |
| 20.10.2021 | 0.158 | 0.495 | 0.067 |
© Bayerisches Landesamt für Umwelt 2024