
- Start >
- Rivers >
- Discharge >
- Regnitz >
- Gerolfingen >
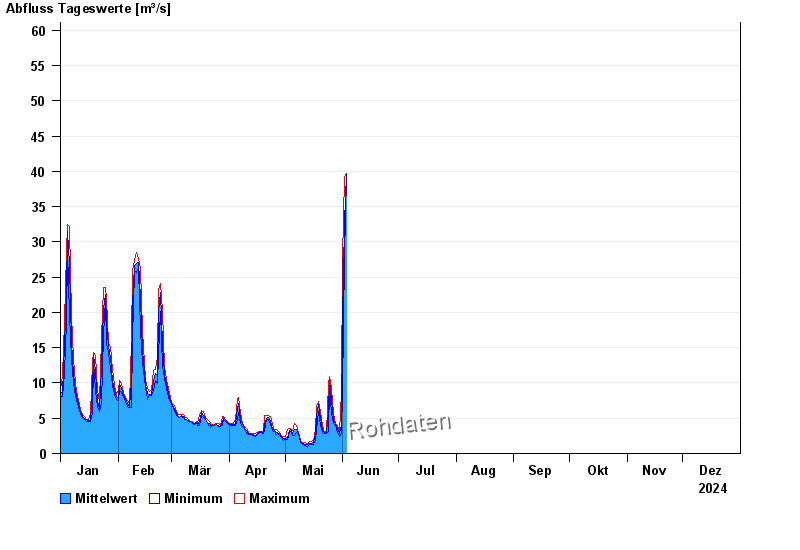
- Chart of year

Chart of year Gerolfingen / Wörnitz
Discharge from 01.01.2024 to 31.12.2024
- 21.12.1993 Abfluss: 229 m³/s
- 13.04.1994 Abfluss: 214 m³/s
- 22.02.1970 Abfluss: 211 m³/s
- 29.10.1998 Abfluss: 193 m³/s
- 07.06.1984 Abfluss: 179 m³/s
| Date | Mean value [m³/s] | Maximum [m³/s] | Minimum [m³/s] |
|---|---|---|---|
| 10.05.2024 | 2.08 | 2.22 | 2.01 |
| 09.05.2024 | 1.67 | 1.91 | 1.55 |
| 08.05.2024 | 2.42 | 3.14 | 1.91 |
| 07.05.2024 | 3.46 | 4.05 | 3.14 |
| 06.05.2024 | 3.47 | 4.32 | 2.66 |
| 05.05.2024 | 2.98 | 3.52 | 2.66 |
| 04.05.2024 | 3.56 | 3.65 | 3.39 |
© Bayerisches Landesamt für Umwelt 2024