
- Start >
- Rivers >
- Discharge >
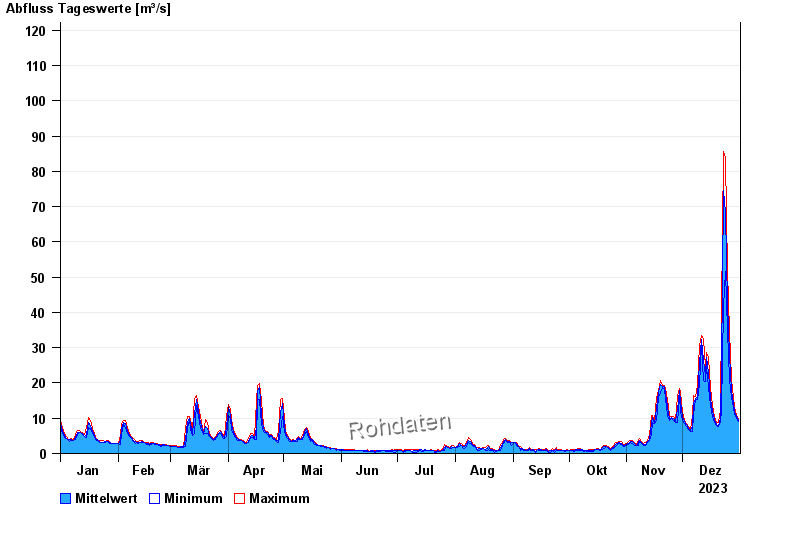
- Regnitz >
- Gerolfingen >
- Chart of year

Chart of year Gerolfingen / Wörnitz
Discharge from 01.01.2023 to 31.12.2023
- 21.12.1993 Abfluss: 229 m³/s
- 13.04.1994 Abfluss: 214 m³/s
- 22.02.1970 Abfluss: 211 m³/s
- 29.10.1998 Abfluss: 193 m³/s
- 07.06.1984 Abfluss: 179 m³/s
| Date | Mean value [m³/s] | Maximum [m³/s] | Minimum [m³/s] |
|---|---|---|---|
| 31.12.2023 | 9.41 | 9.8 | 9.07 |
| 30.12.2023 | 10.4 | 10.9 | 9.8 |
| 29.12.2023 | 12 | 13.1 | 11.1 |
| 28.12.2023 | 14.2 | 15.8 | 13.1 |
| 27.12.2023 | 17.7 | 21.1 | 15.8 |
| 26.12.2023 | 27.8 | 34.6 | 21.1 |
| 25.12.2023 | 42.5 | 51.5 | 34.6 |
© Bayerisches Landesamt für Umwelt 2024