

Chart of total period Erlangen / Schwabach
Discharge from 01.11.1935 to 26.04.2024
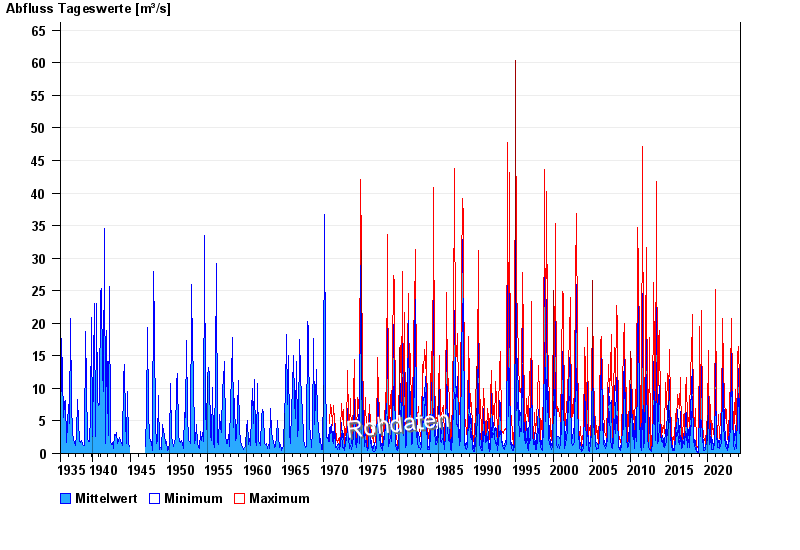
| Date | Mean value [m³/s] | Maximum [m³/s] | Minimum [m³/s] |
|---|---|---|---|
| 26.04.2024 | 0.771 | 0.792 | 0.758 |
| 25.04.2024 | 0.799 | 0.825 | 0.792 |
| 24.04.2024 | 0.829 | 0.859 | 0.792 |
| 23.04.2024 | 0.962 | 1.09 | 0.825 |
| 22.04.2024 | 1.51 | 2.43 | 1.09 |
| 21.04.2024 | 1.96 | 5.87 | 0.859 |
| 20.04.2024 | 1.31 | 1.99 | 0.825 |
© Bayerisches Landesamt für Umwelt 2024