

Chart of total period Erlangen / Schwabach
Discharge from 01.11.1935 to 19.04.2024
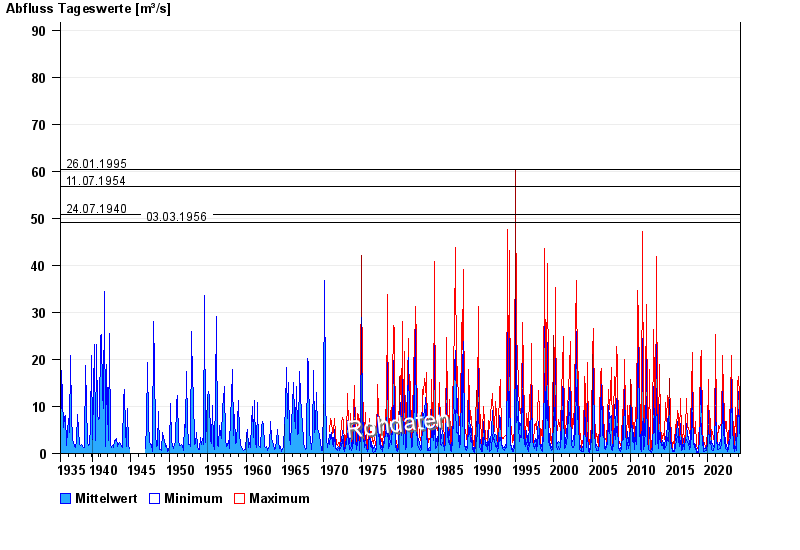
- 29.07.1941 Abfluss: 105 m³/s
- 26.01.1995 Abfluss: 60,3 m³/s
- 11.07.1954 Abfluss: 56,7 m³/s
- 24.07.1940 Abfluss: 50,8 m³/s
- 03.03.1956 Abfluss: 49,1 m³/s
| Date | Mean value [m³/s] | Maximum [m³/s] | Minimum [m³/s] |
|---|---|---|---|
| 19.04.2024 | 0.594 | 0.624 | 0.59 |
| 18.04.2024 | 0.609 | 0.657 | 0.557 |
| 17.04.2024 | 0.693 | 0.825 | 0.624 |
| 16.04.2024 | 0.598 | 0.725 | 0.523 |
| 15.04.2024 | 0.595 | 0.691 | 0.523 |
| 14.04.2024 | 0.583 | 0.59 | 0.557 |
| 13.04.2024 | 0.599 | 0.624 | 0.557 |
© Bayerisches Landesamt für Umwelt 2024