

Chart of year Büg / Schwabach
Discharge from 24.09.2015 to 23.09.2016
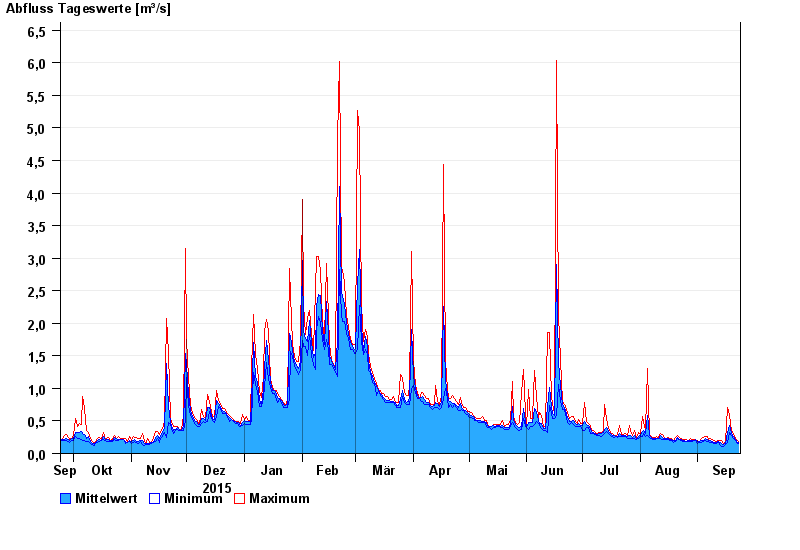
| Date | Mean value [m³/s] | Maximum [m³/s] | Minimum [m³/s] |
|---|---|---|---|
| 23.09.2016 | 0.166 | 0.184 | 0.148 |
| 22.09.2016 | 0.191 | 0.214 | 0.172 |
| 21.09.2016 | 0.22 | 0.23 | 0.199 |
| 20.09.2016 | 0.259 | 0.304 | 0.23 |
| 19.09.2016 | 0.308 | 0.349 | 0.284 |
| 18.09.2016 | 0.431 | 0.587 | 0.328 |
| 17.09.2016 | 0.322 | 0.708 | 0.165 |
© Bayerisches Landesamt für Umwelt 2024