

Chart of year Büg / Schwabach
Discharge from 24.09.2016 to 23.09.2017
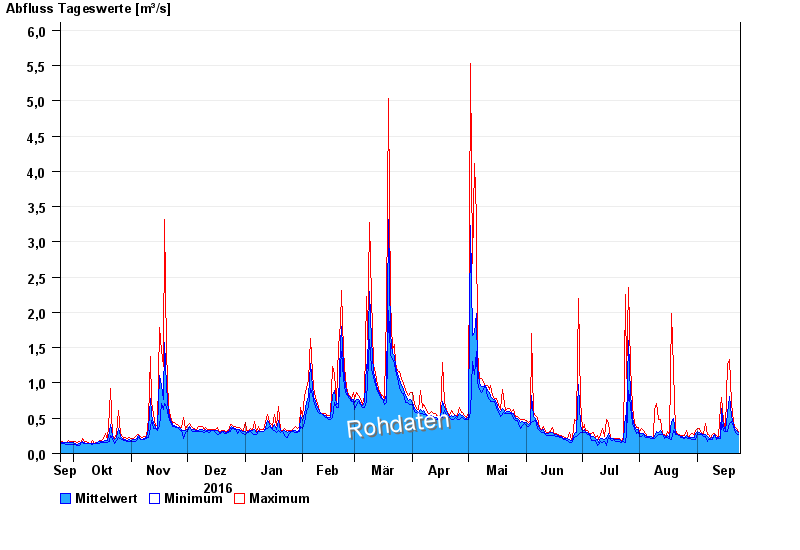
| Date | Mean value [m³/s] | Maximum [m³/s] | Minimum [m³/s] |
|---|---|---|---|
| 23.09.2017 | 0.292 | 0.309 | 0.27 |
| 22.09.2017 | 0.322 | 0.353 | 0.289 |
| 21.09.2017 | 0.355 | 0.377 | 0.33 |
| 20.09.2017 | 0.406 | 0.458 | 0.377 |
| 19.09.2017 | 0.537 | 0.71 | 0.458 |
| 18.09.2017 | 0.812 | 1.33 | 0.429 |
| 17.09.2017 | 0.573 | 1.26 | 0.308 |
© Bayerisches Landesamt für Umwelt 2024