

Chart of year Büg / Schwabach
Discharge from 29.03.2021 to 28.03.2022
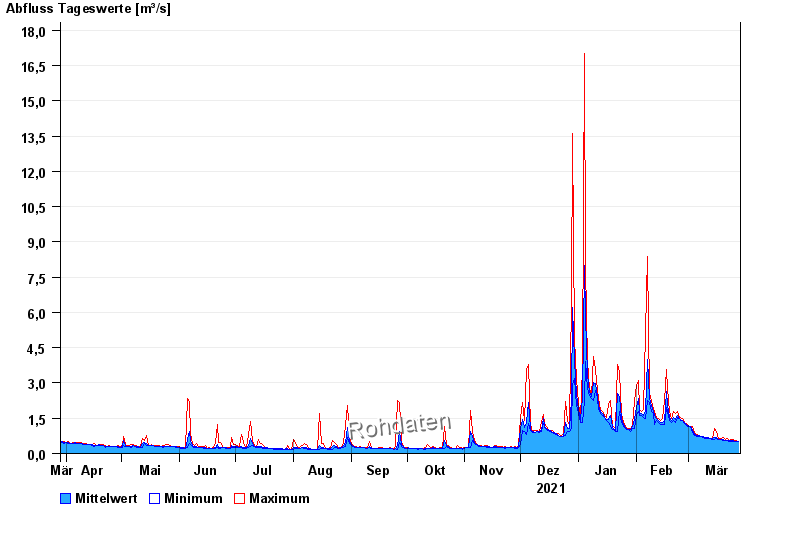
| Date | Mean value [m³/s] | Maximum [m³/s] | Minimum [m³/s] |
|---|---|---|---|
| 28.03.2022 | 0.519 | 0.519 | 0.519 |
| 27.03.2022 | 0.521 | 0.552 | 0.49 |
| 26.03.2022 | 0.527 | 0.552 | 0.49 |
| 25.03.2022 | 0.539 | 0.584 | 0.49 |
| 24.03.2022 | 0.544 | 0.584 | 0.519 |
| 23.03.2022 | 0.543 | 0.552 | 0.519 |
| 22.03.2022 | 0.567 | 0.62 | 0.552 |
© Bayerisches Landesamt für Umwelt 2024