

Chart of year Büg / Schwabach
Discharge from 29.03.2020 to 28.03.2021
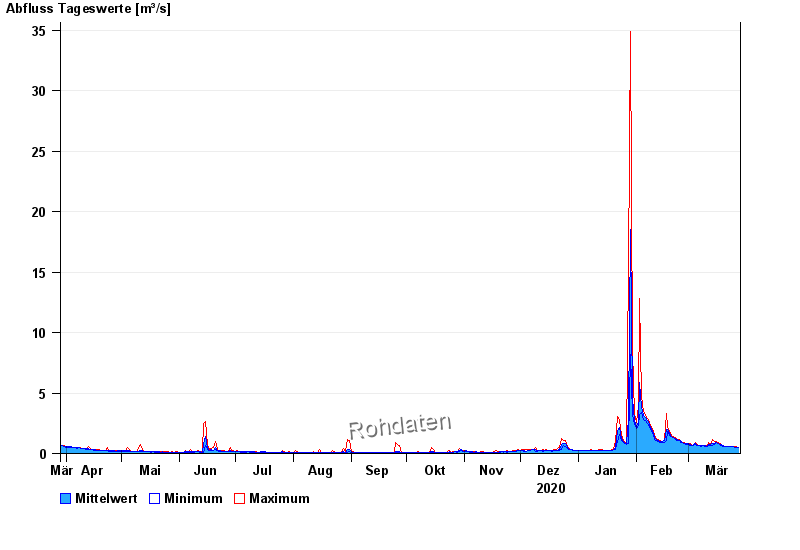
| Date | Mean value [m³/s] | Maximum [m³/s] | Minimum [m³/s] |
|---|---|---|---|
| 28.03.2021 | 0.503 | 0.504 | 0.502 |
| 27.03.2021 | 0.524 | 0.538 | 0.504 |
| 26.03.2021 | 0.536 | 0.54 | 0.507 |
| 25.03.2021 | 0.541 | 0.542 | 0.54 |
| 24.03.2021 | 0.55 | 0.577 | 0.542 |
| 23.03.2021 | 0.575 | 0.58 | 0.544 |
| 22.03.2021 | 0.589 | 0.617 | 0.58 |
© Bayerisches Landesamt für Umwelt 2024