

Chart of year Büg / Schwabach
Discharge from 03.06.2019 to 02.06.2020
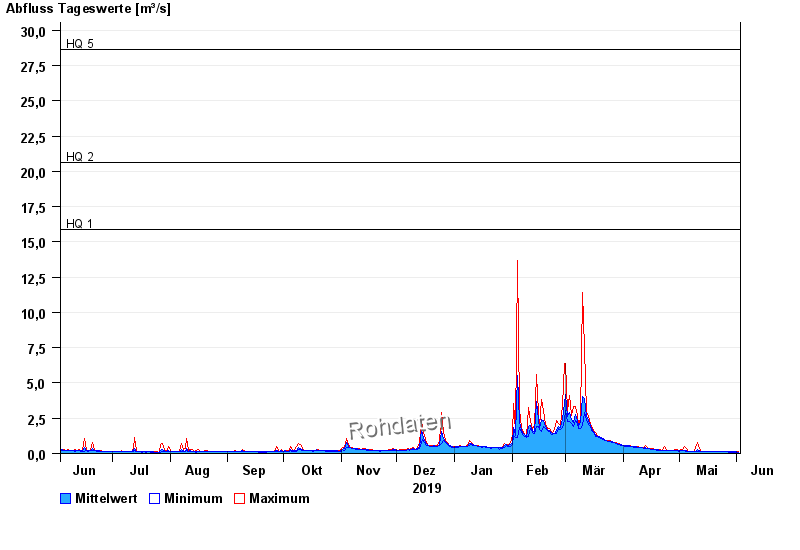
- HQ1 15,9 m³/s
- HQ2 20,6 m³/s
- HQ5 28,6 m³/s
- HQ10 34,6 m³/s
- HQ20 40,4 m³/s
- HQ50 48,5 m³/s
- HQ100 55 m³/s
| Date | Mean value [m³/s] | Maximum [m³/s] | Minimum [m³/s] |
|---|---|---|---|
| 02.06.2020 | 0.104 | 0.12 | 0.094 |
| 01.06.2020 | 0.107 | 0.11 | 0.102 |
| 31.05.2020 | 0.108 | 0.13 | 0.094 |
| 30.05.2020 | 0.109 | 0.13 | 0.102 |
| 29.05.2020 | 0.111 | 0.12 | 0.102 |
| 28.05.2020 | 0.113 | 0.14 | 0.093 |
| 27.05.2020 | 0.116 | 0.119 | 0.11 |
© Bayerisches Landesamt für Umwelt 2024