

Chart of year Büg / Schwabach
Discharge from 03.06.2020 to 02.06.2021
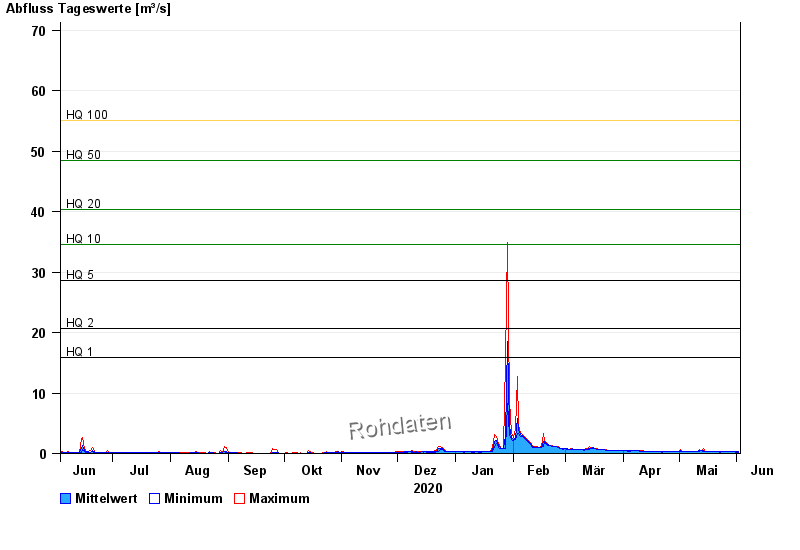
- HQ1 15,9 m³/s
- HQ2 20,6 m³/s
- HQ5 28,6 m³/s
- HQ10 34,6 m³/s
- HQ20 40,4 m³/s
- HQ50 48,5 m³/s
- HQ100 55 m³/s
| Date | Mean value [m³/s] | Maximum [m³/s] | Minimum [m³/s] |
|---|---|---|---|
| 02.06.2021 | 0.249 | 0.259 | 0.226 |
| 01.06.2021 | 0.26 | 0.278 | 0.243 |
| 31.05.2021 | 0.267 | 0.278 | 0.26 |
| 30.05.2021 | 0.279 | 0.297 | 0.26 |
| 29.05.2021 | 0.29 | 0.318 | 0.278 |
| 28.05.2021 | 0.297 | 0.318 | 0.278 |
| 27.05.2021 | 0.314 | 0.34 | 0.298 |
© Bayerisches Landesamt für Umwelt 2024