

Chart of year Büg / Schwabach
Discharge from 01.01.2023 to 31.12.2023
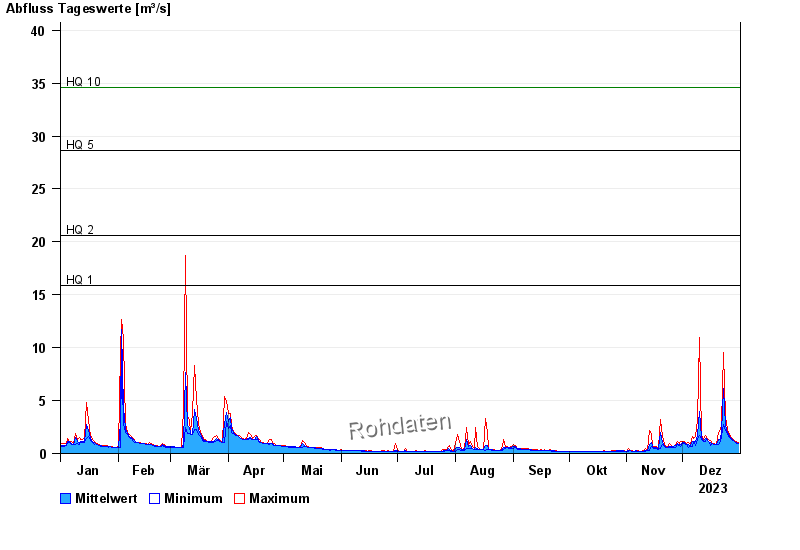
- HQ1 15,9 m³/s
- HQ2 20,6 m³/s
- HQ5 28,6 m³/s
- HQ10 34,6 m³/s
- HQ20 40,4 m³/s
- HQ50 48,5 m³/s
- HQ100 55 m³/s
| Date | Mean value [m³/s] | Maximum [m³/s] | Minimum [m³/s] |
|---|---|---|---|
| 31.12.2023 | 0.992 | 1.03 | 0.975 |
| 30.12.2023 | 1.03 | 1.09 | 0.975 |
| 29.12.2023 | 1.12 | 1.21 | 1.09 |
| 28.12.2023 | 1.25 | 1.35 | 1.21 |
| 27.12.2023 | 1.4 | 1.49 | 1.28 |
| 26.12.2023 | 1.65 | 1.82 | 1.49 |
| 25.12.2023 | 2 | 2.29 | 1.82 |
© Bayerisches Landesamt für Umwelt 2024