

Chart of year Büg / Schwabach
Discharge from 01.01.2022 to 31.12.2022
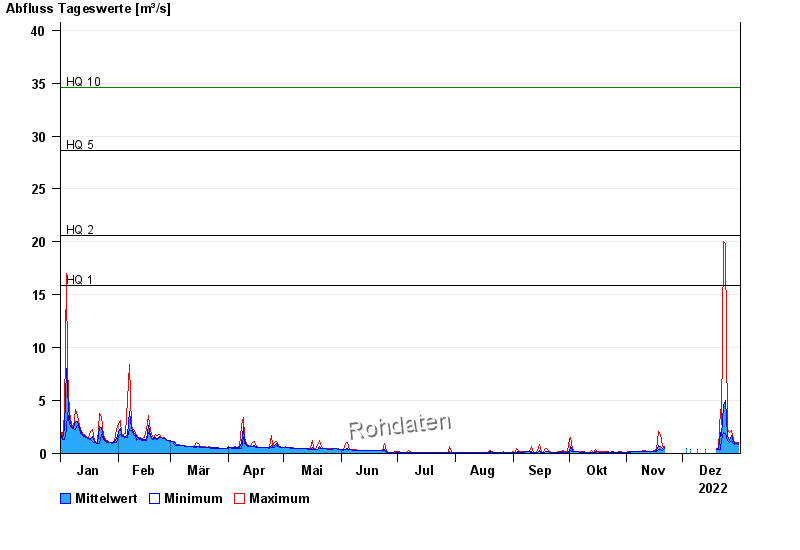
- HQ1 15,9 m³/s
- HQ2 20,6 m³/s
- HQ5 28,6 m³/s
- HQ10 34,6 m³/s
- HQ20 40,4 m³/s
- HQ50 48,5 m³/s
- HQ100 55 m³/s
| Date | Mean value [m³/s] | Maximum [m³/s] | Minimum [m³/s] |
|---|---|---|---|
| 31.12.2022 | 0.907 | 1.01 | 0.857 |
| 30.12.2022 | 0.94 | 1.01 | 0.899 |
| 29.12.2022 | 0.927 | 1.01 | 0.857 |
| 28.12.2022 | 1.11 | 1.31 | 0.955 |
| 27.12.2022 | 1.67 | 2.22 | 1.24 |
| 26.12.2022 | 1.27 | 2.02 | 1.06 |
| 25.12.2022 | 1.67 | 2.31 | 1.24 |
© Bayerisches Landesamt für Umwelt 2024