
- Start >
- Rivers >
- Discharge >
- Regnitz >
- Behringersmühle >
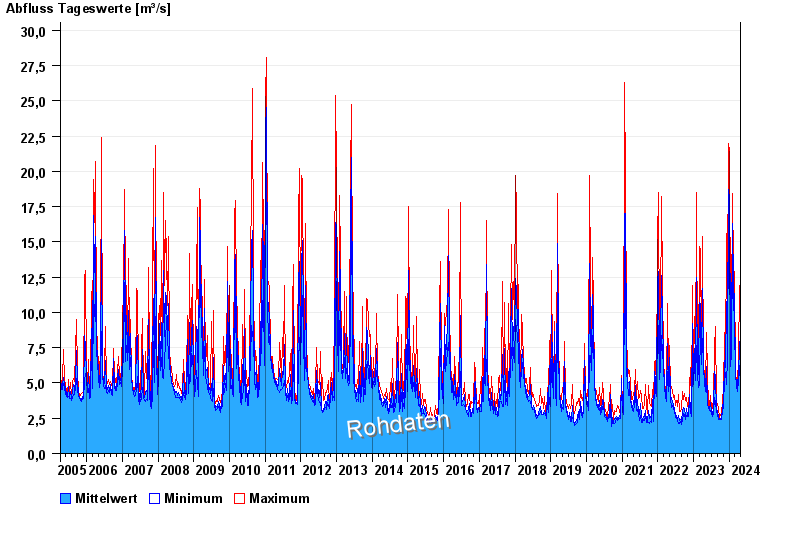
- Chart of total period

Chart of total period Behringersmühle / Wiesent
Discharge from 07.04.2005 to 26.04.2024
| Date | Mean value [m³/s] | Maximum [m³/s] | Minimum [m³/s] |
|---|---|---|---|
| 26.04.2024 | 5.61 | 5.81 | 5.37 |
| 25.04.2024 | 5.56 | 5.66 | 5.52 |
| 24.04.2024 | 5.69 | 6.1 | 5.37 |
| 23.04.2024 | 6.29 | 7.02 | 5.81 |
| 22.04.2024 | 8.5 | 11.6 | 6.71 |
| 21.04.2024 | 7.41 | 11.9 | 5.81 |
| 20.04.2024 | 6.82 | 8.26 | 5.81 |
© Bayerisches Landesamt für Umwelt 2024