
- Start >
- Rivers >
- Discharge >
- Regnitz >
- Behringersmühle >
- Chart of total period

Chart of total period Behringersmühle / Wiesent
Discharge from 07.04.2005 to 20.04.2024
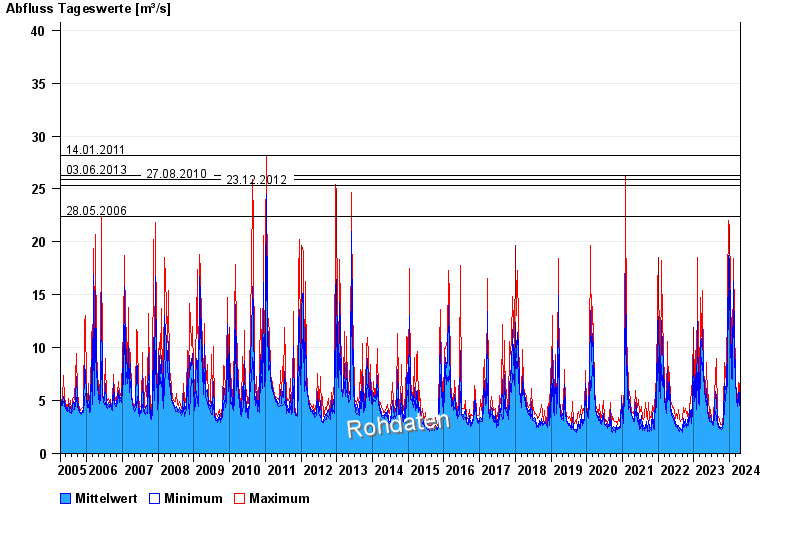
- 14.01.2011 Abfluss: 28,2 m³/s
- 03.06.2013 Abfluss: 26,3 m³/s
- 27.08.2010 Abfluss: 25,9 m³/s
- 23.12.2012 Abfluss: 25,3 m³/s
- 28.05.2006 Abfluss: 22,4 m³/s
| Date | Mean value [m³/s] | Maximum [m³/s] | Minimum [m³/s] |
|---|---|---|---|
| 20.04.2024 | 7.13 | 7.63 | 6.71 |
| 19.04.2024 | 4.73 | 7.02 | 4.14 |
| 18.04.2024 | 4.46 | 4.53 | 4.4 |
| 17.04.2024 | 4.59 | 4.81 | 4.4 |
| 16.04.2024 | 4.1 | 4.4 | 3.77 |
| 15.04.2024 | 3.96 | 4.14 | 3.89 |
| 14.04.2024 | 3.97 | 4.14 | 3.89 |
© Bayerisches Landesamt für Umwelt 2024