

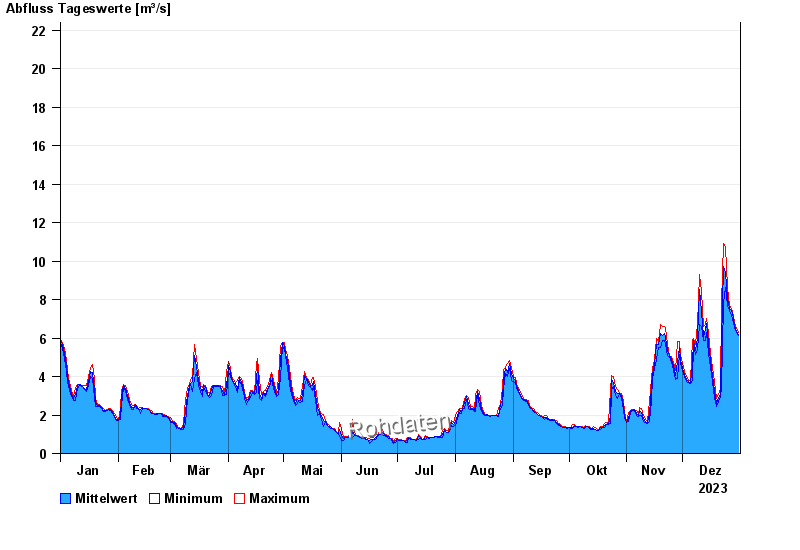
Chart of year Aha / Altmühl
Discharge from 01.01.2023 to 31.12.2023
- HQ1 41 m³/s
- HQ2 57 m³/s
- HQ5 75 m³/s
- HQ10 98 m³/s
- HQ20 120 m³/s
- HQ50 150 m³/s
- HQ100 180 m³/s
| Date | Mean value [m³/s] | Maximum [m³/s] | Minimum [m³/s] |
|---|---|---|---|
| 31.12.2023 | 6.19 | 6.31 | 6.13 |
| 30.12.2023 | 6.36 | 6.51 | 6.31 |
| 29.12.2023 | 6.63 | 6.81 | 6.51 |
| 28.12.2023 | 7.01 | 7.17 | 6.81 |
| 27.12.2023 | 7.41 | 7.55 | 7.17 |
| 26.12.2023 | 7.55 | 7.69 | 7.42 |
| 25.12.2023 | 8.07 | 8.61 | 7.69 |
© Bayerisches Landesamt für Umwelt 2024