

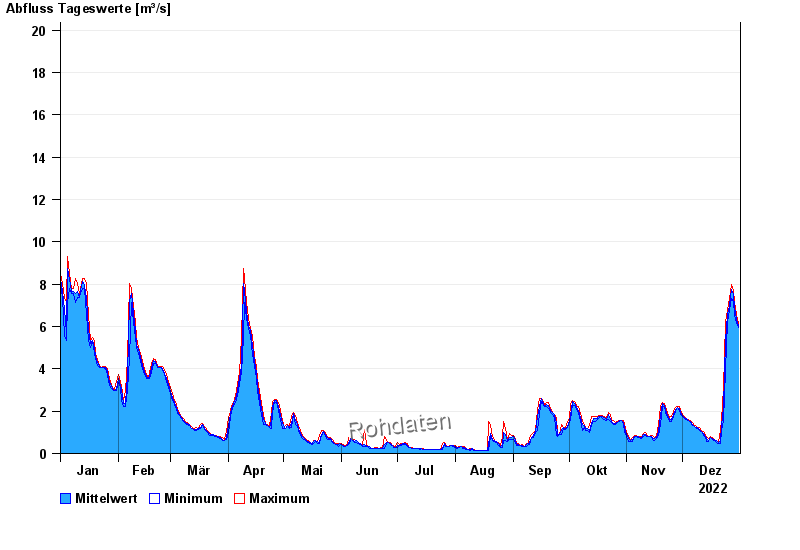
Chart of year Aha / Altmühl
Discharge from 01.01.2022 to 31.12.2022
- HQ1 41 m³/s
- HQ2 57 m³/s
- HQ5 75 m³/s
- HQ10 98 m³/s
- HQ20 120 m³/s
- HQ50 150 m³/s
- HQ100 180 m³/s
| Date | Mean value [m³/s] | Maximum [m³/s] | Minimum [m³/s] |
|---|---|---|---|
| 31.12.2022 | 6.05 | 6.12 | 5.94 |
| 30.12.2022 | 6.33 | 6.59 | 6.12 |
| 29.12.2022 | 6.9 | 7.17 | 6.59 |
| 28.12.2022 | 7.49 | 7.7 | 7.17 |
| 27.12.2022 | 7.77 | 8 | 7.3 |
| 26.12.2022 | 6.97 | 7.3 | 6.81 |
| 25.12.2022 | 6.59 | 6.81 | 6.21 |
© Bayerisches Landesamt für Umwelt 2024