
- Start >
- Rivers >
- Discharge >
- Untere Donau >
- Viechtach Reibenmühle >
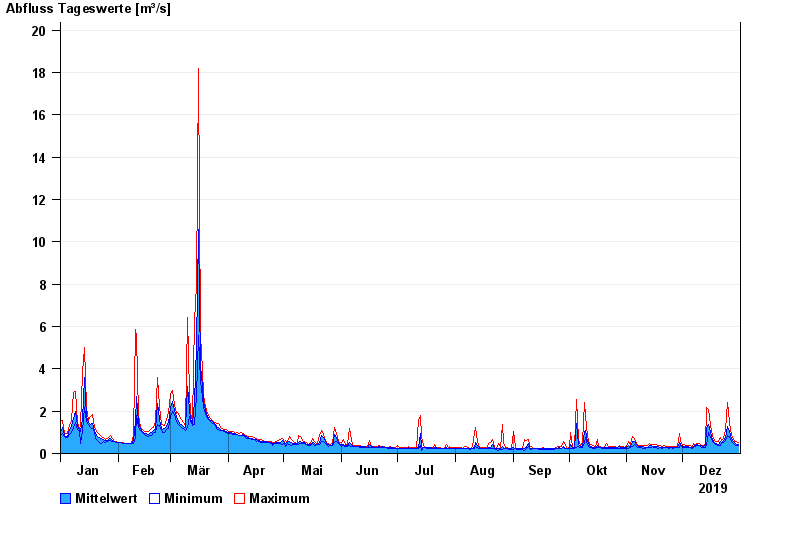
- Chart of year

Chart of year Viechtach Reibenmühle / Aitnach
Discharge from 01.01.2019 to 31.12.2019
| Date | Mean value [m³/s] | Maximum [m³/s] | Minimum [m³/s] |
|---|---|---|---|
| 31.12.2019 | 0.428 | 0.504 | 0.393 |
| 30.12.2019 | 0.448 | 0.588 | 0.39 |
| 29.12.2019 | 0.498 | 0.589 | 0.436 |
| 28.12.2019 | 0.567 | 0.664 | 0.468 |
| 27.12.2019 | 0.698 | 0.828 | 0.58 |
| 26.12.2019 | 1.03 | 1.46 | 0.783 |
| 25.12.2019 | 1.26 | 2.4 | 0.831 |
© Bayerisches Landesamt für Umwelt 2024