
- Start >
- Rivers >
- Discharge >
- Untere Donau >
- Viechtach Reibenmühle >
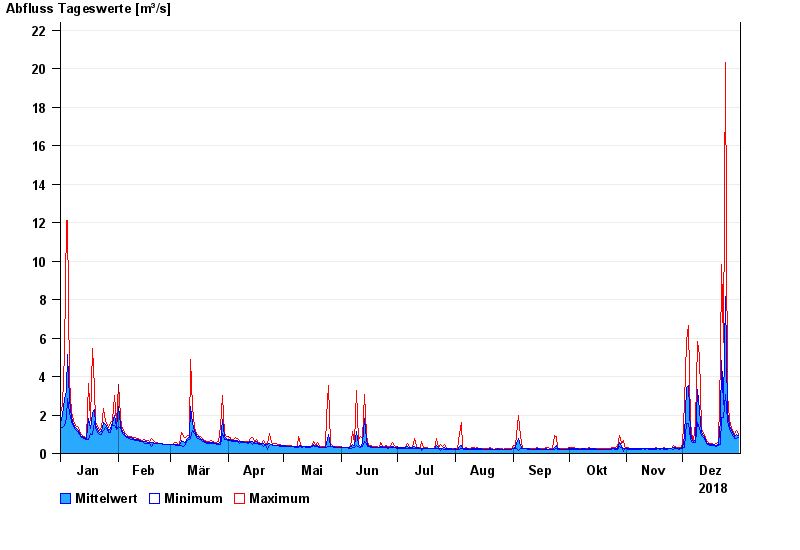
- Chart of year

Chart of year Viechtach Reibenmühle / Aitnach
Discharge from 01.01.2018 to 31.12.2018
| Date | Mean value [m³/s] | Maximum [m³/s] | Minimum [m³/s] |
|---|---|---|---|
| 31.12.2018 | 0.912 | 0.992 | 0.836 |
| 30.12.2018 | 0.968 | 1.21 | 0.791 |
| 29.12.2018 | 0.866 | 1.01 | 0.805 |
| 28.12.2018 | 0.999 | 1.1 | 0.902 |
| 27.12.2018 | 1.19 | 1.3 | 1.05 |
| 26.12.2018 | 1.48 | 1.75 | 1.24 |
| 25.12.2018 | 2.18 | 3.08 | 1.69 |
© Bayerisches Landesamt für Umwelt 2024