
- Start >
- Rivers >
- Discharge >
- Untere Donau >
- Teisnach >
- Chart of total period

Chart of total period Teisnach / Schwarzer Regen
Discharge from 01.11.1930 to 26.04.2024
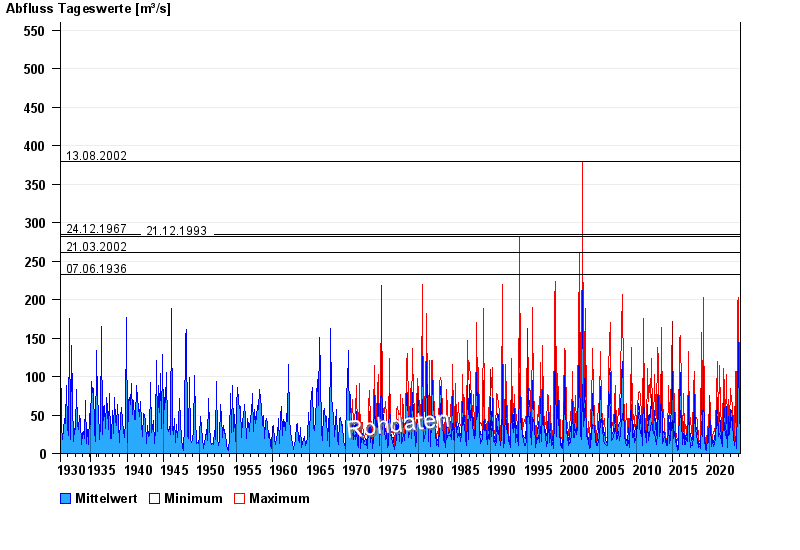
- 13.08.2002 Abfluss: 380 m³/s
- 24.12.1967 Abfluss: 285 m³/s
- 21.12.1993 Abfluss: 282 m³/s
- 21.03.2002 Abfluss: 261 m³/s
- 07.06.1936 Abfluss: 232 m³/s
| Date | Mean value [m³/s] | Maximum [m³/s] | Minimum [m³/s] |
|---|---|---|---|
| 26.04.2024 | 15.8 | 15.8 | 15.8 |
| 25.04.2024 | 15.9 | 16.5 | 15.2 |
| 24.04.2024 | 16.8 | 19.9 | 15.2 |
| 23.04.2024 | 18.4 | 19.9 | 17.2 |
| 22.04.2024 | 21.3 | 23.4 | 19.2 |
| 21.04.2024 | 26.9 | 36.2 | 22.7 |
| 20.04.2024 | 38.3 | 45 | 27.3 |
© Bayerisches Landesamt für Umwelt 2024