
- Start >
- Rivers >
- Discharge >
- Untere Donau >
- Teisnach >
- Chart of total period

Chart of total period Teisnach / Schwarzer Regen
Discharge from 01.11.1930 to 24.04.2024
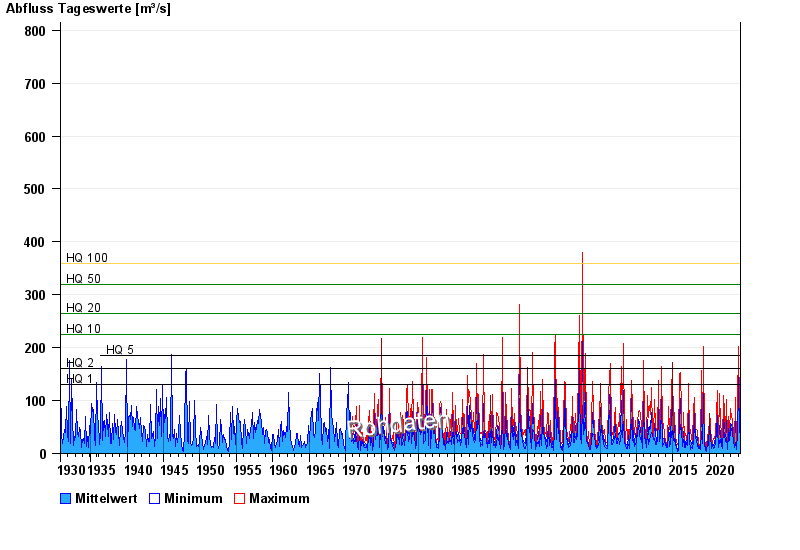
- HQ1 130 m³/s
- HQ2 160 m³/s
- HQ5 185 m³/s
- HQ10 225 m³/s
- HQ20 265 m³/s
- HQ50 320 m³/s
- HQ100 360 m³/s
| Date | Mean value [m³/s] | Maximum [m³/s] | Minimum [m³/s] |
|---|---|---|---|
| 24.04.2024 | 16.8 | 19.9 | 15.2 |
| 23.04.2024 | 18.4 | 19.9 | 17.2 |
| 22.04.2024 | 21.3 | 23.4 | 19.2 |
| 21.04.2024 | 26.9 | 36.2 | 22.7 |
| 20.04.2024 | 38.3 | 45 | 27.3 |
| 19.04.2024 | 18.1 | 25.7 | 16.5 |
| 18.04.2024 | 18.4 | 19.9 | 17.2 |
© Bayerisches Landesamt für Umwelt 2024