
- Start >
- Rivers >
- Discharge >
- Untere Donau >
- Schönberg >
- Chart of year

Chart of year Schönberg / Große Ohe
Discharge from 04.07.2019 to 03.07.2020
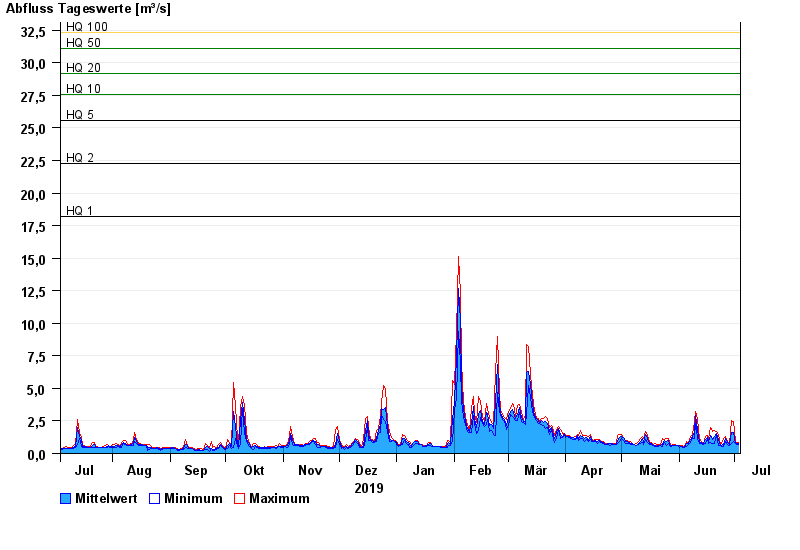
- HQ1 18,2 m³/s
- HQ2 22,3 m³/s
- HQ5 25,6 m³/s
- HQ10 27,6 m³/s
- HQ20 29,2 m³/s
- HQ50 31,1 m³/s
- HQ100 32,3 m³/s
| Date | Mean value [m³/s] | Maximum [m³/s] | Minimum [m³/s] |
|---|---|---|---|
| 03.07.2020 | 0.764 | 0.835 | 0.689 |
| 02.07.2020 | 0.761 | 0.835 | 0.69 |
| 01.07.2020 | 0.794 | 0.89 | 0.737 |
| 30.06.2020 | 1.65 | 2.47 | 0.89 |
| 29.06.2020 | 1.64 | 2.55 | 0.787 |
| 28.06.2020 | 0.723 | 0.788 | 0.647 |
| 27.06.2020 | 0.818 | 0.948 | 0.693 |
© Bayerisches Landesamt für Umwelt 2024