
- Start >
- Rivers >
- Discharge >
- Untere Donau >
- Schönberg >
- Chart of year

Chart of year Schönberg / Große Ohe
Discharge from 04.07.2020 to 03.07.2021
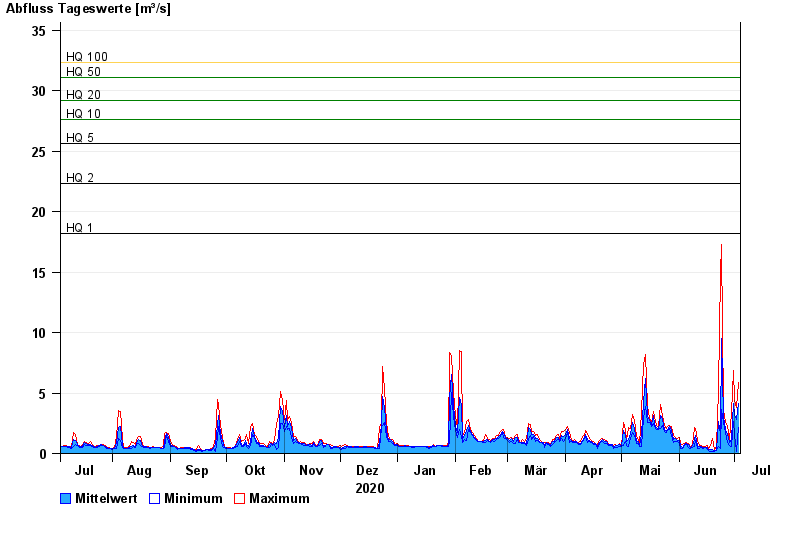
- HQ1 18,2 m³/s
- HQ2 22,3 m³/s
- HQ5 25,6 m³/s
- HQ10 27,6 m³/s
- HQ20 29,2 m³/s
- HQ50 31,1 m³/s
- HQ100 32,3 m³/s
| Date | Mean value [m³/s] | Maximum [m³/s] | Minimum [m³/s] |
|---|---|---|---|
| 03.07.2021 | 4.15 | 5.9 | 2.11 |
| 02.07.2021 | 2.85 | 3.81 | 0.177 |
| 01.07.2021 | 3.21 | 4.4 | 1.46 |
| 30.06.2021 | 4.14 | 6.89 | 2.66 |
| 29.06.2021 | 1.13 | 3.39 | 0.57 |
| 28.06.2021 | 0.936 | 1.13 | 0.625 |
| 27.06.2021 | 1.59 | 2.3 | 0.936 |
© Bayerisches Landesamt für Umwelt 2024