
- Start >
- Rivers >
- Discharge >
- Untere Donau >
- Postmünster >
- Chart of year

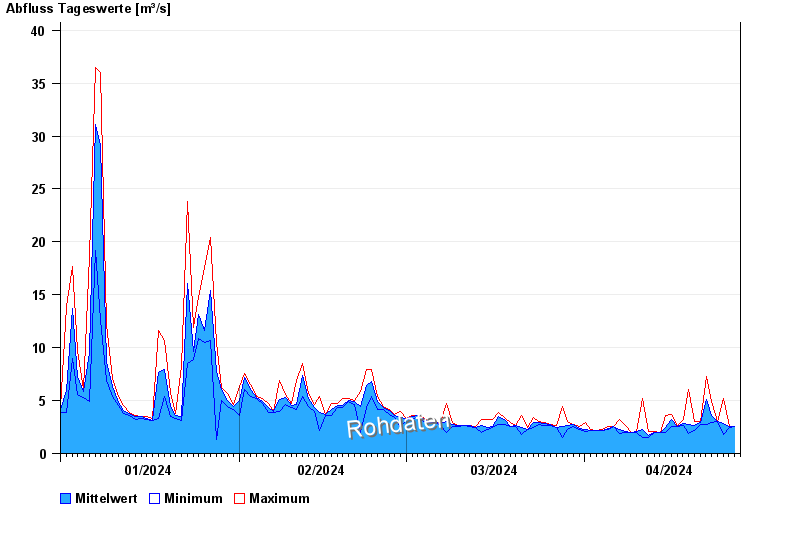
Chart of year Postmünster / Rott
Discharge from 01.01.2024 to 27.04.2024
| Date | Mean value [m³/s] | Maximum [m³/s] | Minimum [m³/s] |
|---|---|---|---|
| 27.04.2024 | 2.53 | 2.53 | 2.53 |
| 26.04.2024 | 2.52 | 2.53 | 2.42 |
| 25.04.2024 | 2.83 | 5.21 | 1.78 |
| 24.04.2024 | 3.04 | 3.04 | 3.04 |
| 23.04.2024 | 3.63 | 4.9 | 2.91 |
| 22.04.2024 | 5.11 | 7.23 | 2.78 |
| 21.04.2024 | 2.93 | 3.04 | 2.78 |
© Bayerisches Landesamt für Umwelt 2024