
- Start >
- Rivers >
- Discharge >
- Untere Donau >
- Postmünster >
- Chart of year

Chart of year Postmünster / Rott
Discharge from 28.04.2024 to 27.04.2025
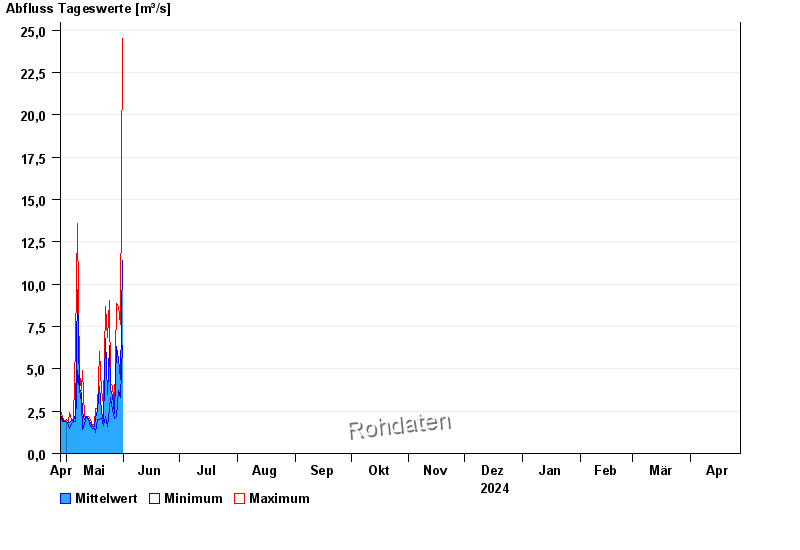
| Date | Mean value [m³/s] | Maximum [m³/s] | Minimum [m³/s] |
|---|---|---|---|
| 09.05.2024 | 3.72 | 3.72 | 3.72 |
| 08.05.2024 | 3.82 | 4.75 | 3.72 |
| 07.05.2024 | 9.69 | 13.6 | 4.9 |
| 06.05.2024 | 2.29 | 6.53 | 1.88 |
| 05.05.2024 | 1.97 | 1.98 | 1.88 |
| 04.05.2024 | 1.94 | 1.98 | 1.78 |
| 03.05.2024 | 1.86 | 2.42 | 1.5 |
© Bayerisches Landesamt für Umwelt 2024