
- Start >
- Rivers >
- Discharge >
- Untere Donau >
- Münchshofen >
- Chart of year

Chart of year Münchshofen / Naab
Discharge from 01.01.2021 to 31.12.2021
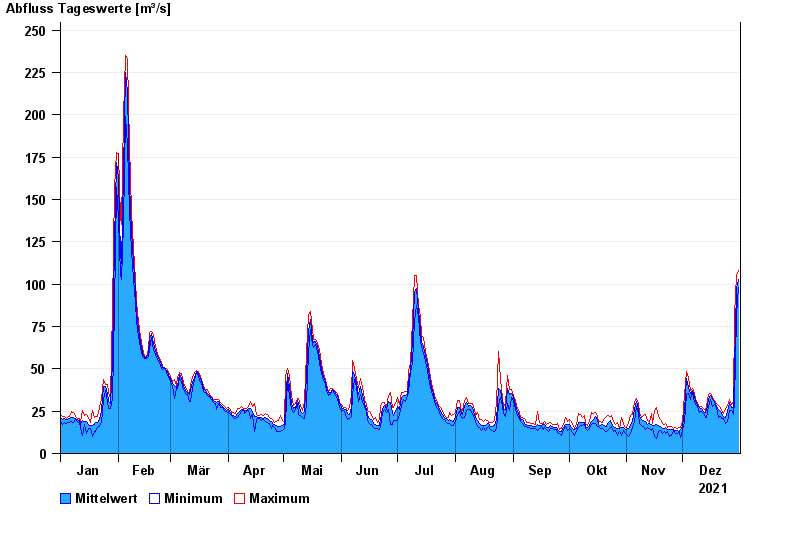
| Date | Mean value [m³/s] | Maximum [m³/s] | Minimum [m³/s] |
|---|---|---|---|
| 31.12.2021 | 103 | 108 | 98.3 |
| 30.12.2021 | 97.2 | 105 | 81.5 |
| 29.12.2021 | 51.5 | 81.5 | 30.7 |
| 28.12.2021 | 27.2 | 30.7 | 22.9 |
| 27.12.2021 | 27.3 | 28.8 | 25.2 |
| 26.12.2021 | 30.2 | 31.9 | 25.2 |
| 25.12.2021 | 25 | 28.2 | 19.1 |
© Bayerisches Landesamt für Umwelt 2025